
FPA New Income Fund commentary and webcast slides for the fourth quarter ended December 31, 2018.
Q4 hedge fund letters, conference, scoops etc
FPA New Income Fund 4Q18 Webcast Audio
FPA New Income Fund 4Q18 Commentary
Dear Fellow Shareholders,
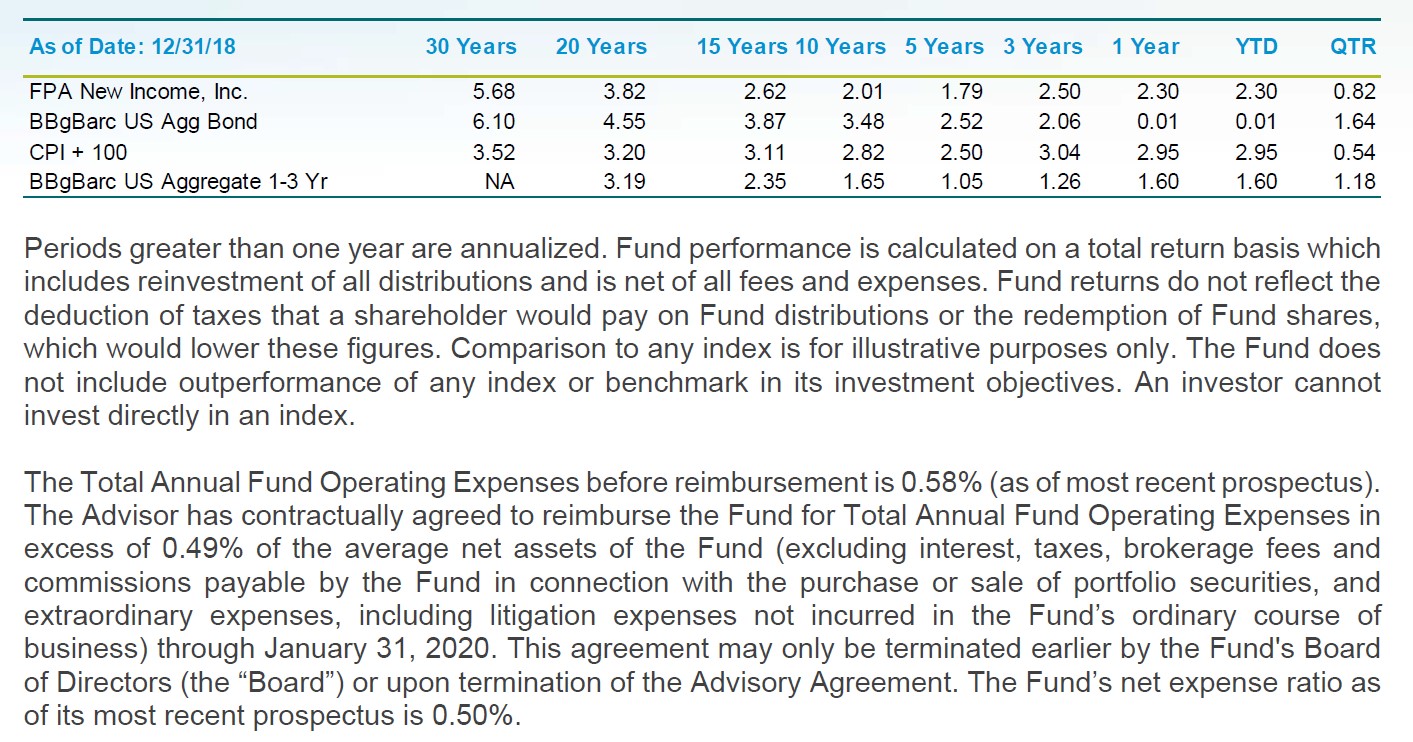
FPA New Income, Inc. (the “Fund”) returned 0.82% in the fourth quarter of 2018 and 2.30% for the year that ended Dec. 31, 2018.
In a year in which most asset classes did not do well, the Fund’s performance stood out with a 2.30% return in 2018, as shown below:
While we believe we are valued for consistently generating positive annual returns, what is less appreciated is how those yearly returns have supported the Fund’s long-term results as well. As of Dec. 31, the Fund outperformed the Bloomberg Barclays U.S. Aggregate Bond Index and the Bloomberg Barclays U.S. Aggregate 1-3 Year Bond Index on a cumulative basis over one-year, two-years, three-years and fouryears. That outperformance over multiple years reflects the benefits of our active management, patience and discipline. We were patient in adding duration to our portfolio, preferring to wait until 2017-18, when rates were higher. Notably, from November 2017 to November 2018, when the 2-year Treasury yield increased by over 100 basis points, the Bloomberg Barclays U.S. Aggregate Bond Index lost 2.38% because its long-duration holdings traded to a lower price as investors required higher yields. In comparison, the Fund extended its duration and returned 1.78% during the same period. In other words, even though both the overall bond market and the Fund became more attractive from a yield and duration perspective over that period, the Fund made money along the way while the overall bond market1 lost money! We were also disciplined about our credit exposure, leading us to reduce our exposure as the market for credit became expensive.
As the year progressed, both of those decisions paid off. The new longer-duration bonds added to our returns when rates declined in the fourth quarter, and our low credit exposure prevented credit from being a significant drag on our overall performance. Having said that, our corporate credit holdings generated a positive total return in 2018, while the broader leveraged loan and high-yield markets were flat to down for the year. Through discipline and consistent performance, we strive to provide a less volatile return that outperforms over a multi-year period. This past year showed the fruit of those efforts and rewarded our long-term investors for their conviction.
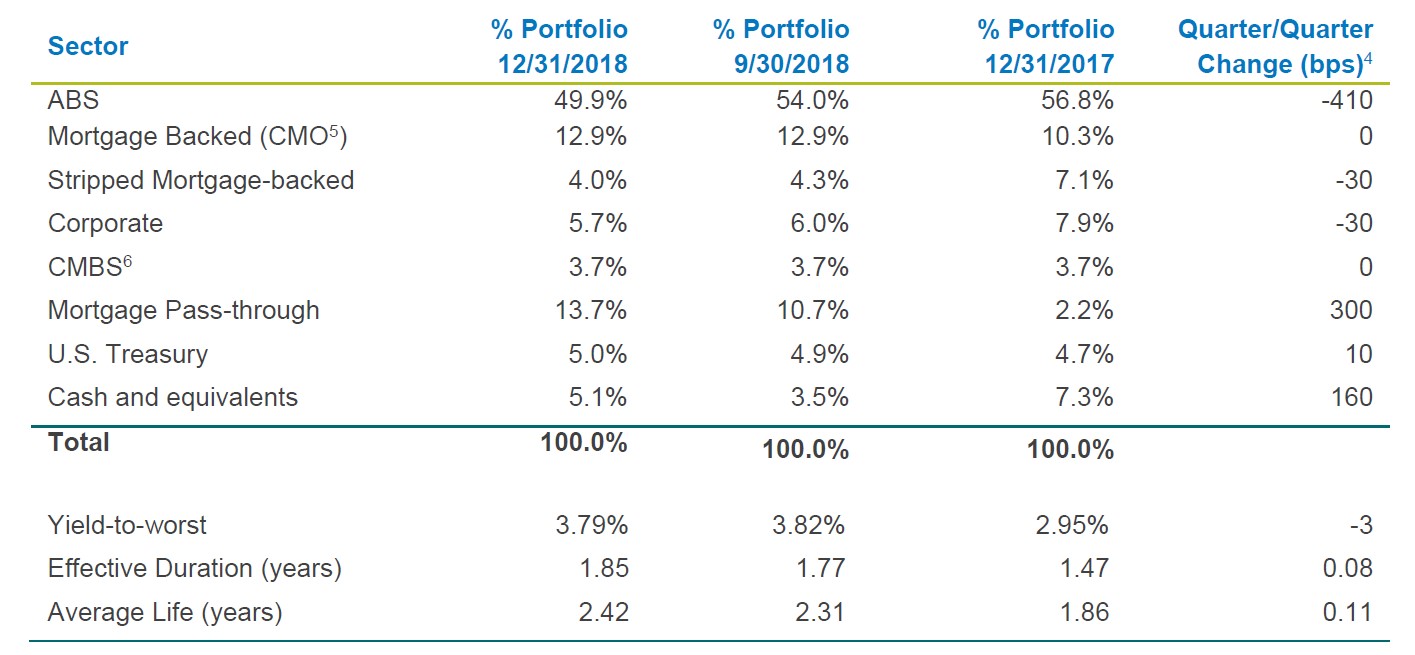
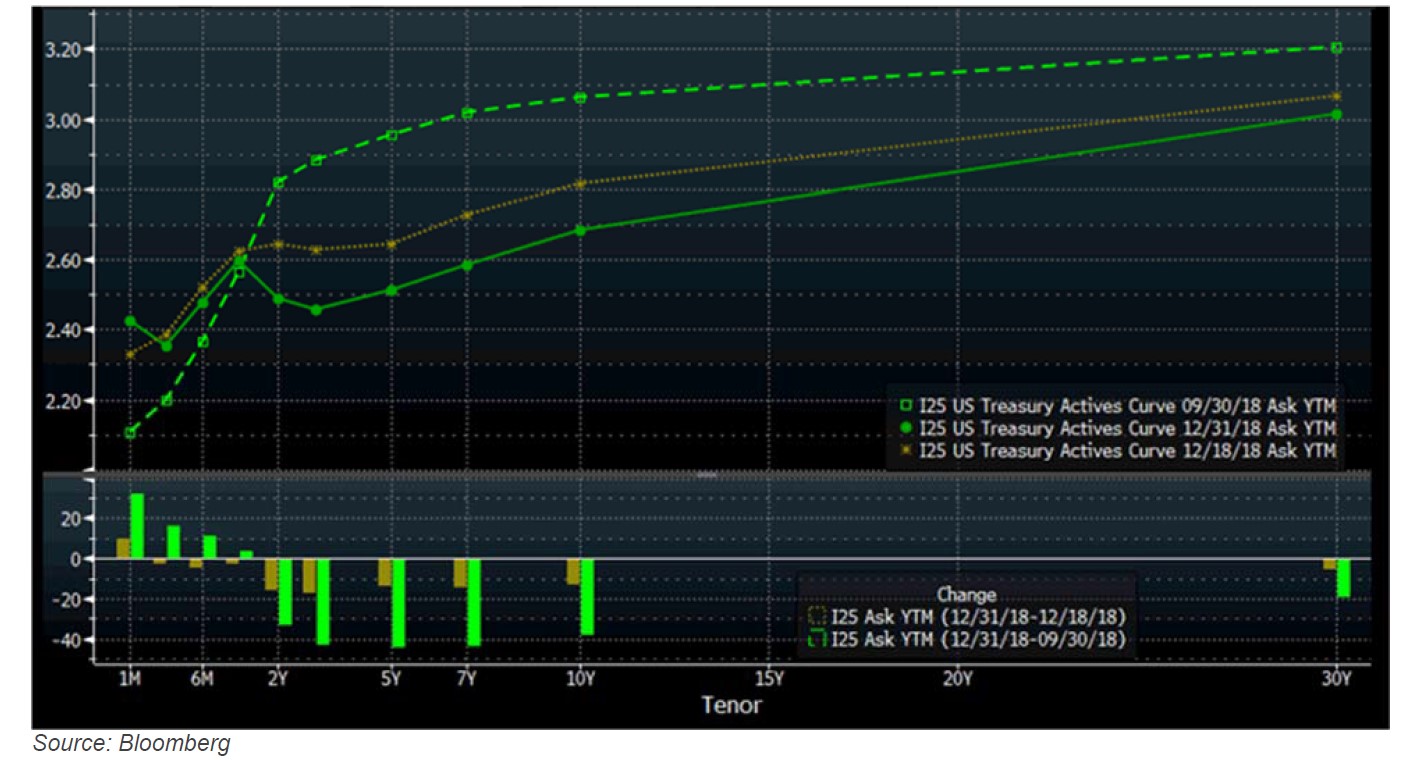
As of Dec. 31, the portfolio had a yield-to-worst of 3.79% and an effective duration of 1.85 years.2 After rising and flattening for the first three quarters of the year, the Treasury yield curve technically inverted during the fourth quarter, with the 2-year Treasury yielding more than the 5-year Treasury. The more traditional measure of the curve’s steepness – 2-year Treasury yields versus 10-year Treasury yields – merely flattened without inverting. This happened as the Federal Reserve tightened monetary policy, which triggered higher yields for Treasury bonds maturing within a year and lowering yields for Treasury bonds maturing beyond a year. With duration becoming more expensive, we paused our efforts to extend the duration of the portfolio and opted to wait for better opportunities. While equity markets tumbled in the last three months of 2018, prices for leveraged loans and high-yield bonds fell as well. We used the opportunity to selectively add to our credit holdings (defined as investments, including corporates and structured products, rated less than A-). As a result, the portfolio’s credit-sensitive holdings increased slightly to 7.3% as of Dec. 31, compared to 7.2% on Sept. 30, 2018. Cash and equivalents increased to 5.1% of the Fund, versus 3.5% at the end of the third quarter.
Portfolio Attribution
Fourth Quarter 2018
The largest contributors to performance during the fourth quarter were agency mortgage pools, which appreciated in price as interest rates declined. For the first 10 months of the year, as interest rates increased, we added longer-duration agency mortgage pools to the portfolio. The intent was to introduce upside optionality into the portfolio if interest rates declined. That scenario played out in the last six weeks of the year and our agency mortgage pools increased in value as a result.
The second-largest contributors to performance were asset-backed securities (ABS) backed by auto loans (prime or subprime loans), which benefited from a combination of coupon payments and higher prices due to lower interest rates. For similar reasons, asset-backed securities backed by equipment were the thirdlargest contributors to performance.
The only detractors from performance in the fourth quarter were corporate high-yield bonds, a loss caused mostly by an investment in an energy-related company that suffered price declines due to lower oil prices and company specific reasons.
Calendar Year 2018
The largest contributors to performance were asset-backed securities backed by auto loans, with coupon payments offsetting a slight decline in price that was caused by higher interest rates year-over-year. Collateralized loan obligations (“CLOs”) were the second-largest contributors to performance, with coupon returns offsetting lower prices caused by higher spreads. These higher spreads were triggered by turmoil in the leveraged loan market.
The third-largest contributors to performance were Ginnie Mae project loan interest-only bonds. These bonds benefited from coupon payments in addition to prices that did not decline as much as expected. As a matter of course, interest-only bonds decline in price over time. However, returns will be higher than expected when prices do not decline as quickly as expected. That happened in 2018 because spreads tightened.
Though our corporate holdings overall contributed to performance, our energy-related investments detracted from performance for the year.
Portfolio Activity
The table below shows the portfolio’s exposures as of Dec. 31, 2017, Sept. 30, 2018 and Dec. 31, 2018:
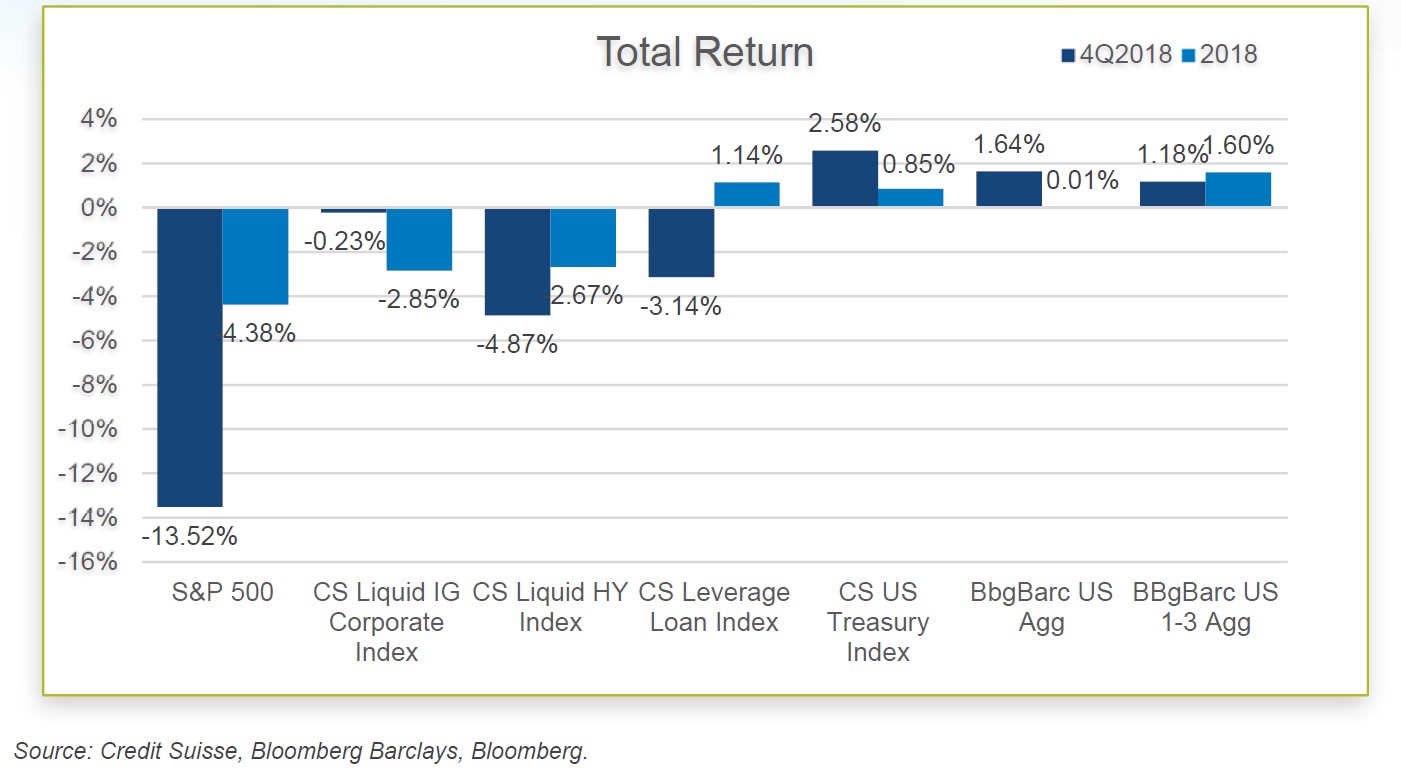
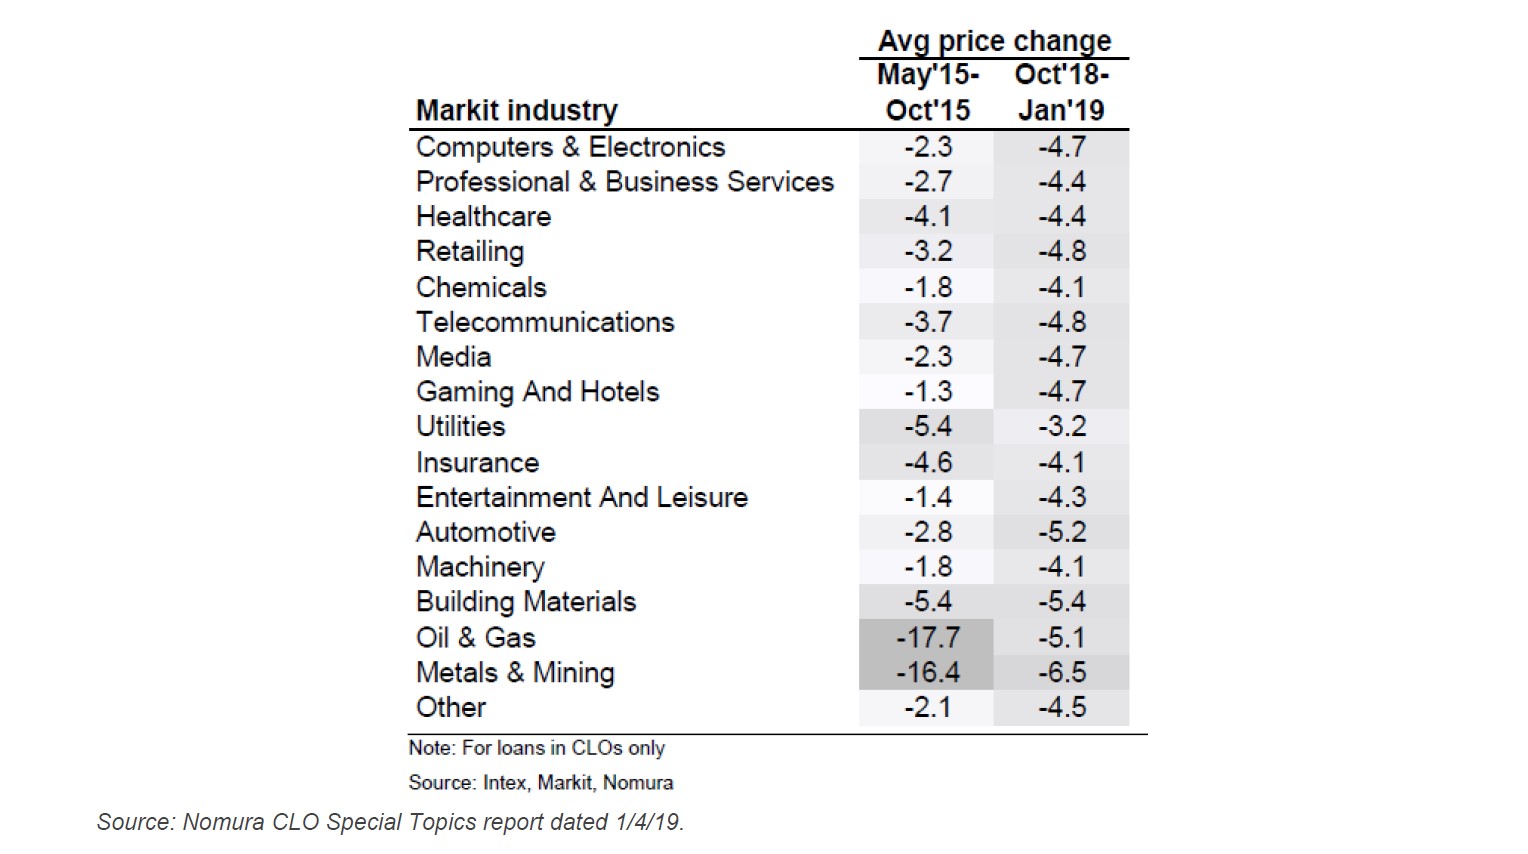
Risk markets experienced a tumultuous fourth quarter. The S&P 500 lost 13.5% in the fourth quarter, leveraged loan prices fell by 7%7 and high-yield bond prices fell over 6%.8 Oil prices were down 39% in the last three months of the year. Unlike 2015-16, when the credit sell-off was driven by the energy sector, the 2018 sell-off was more broad-based, with fairly uniform price declines across sectors in the leveraged loan market (as shown below).
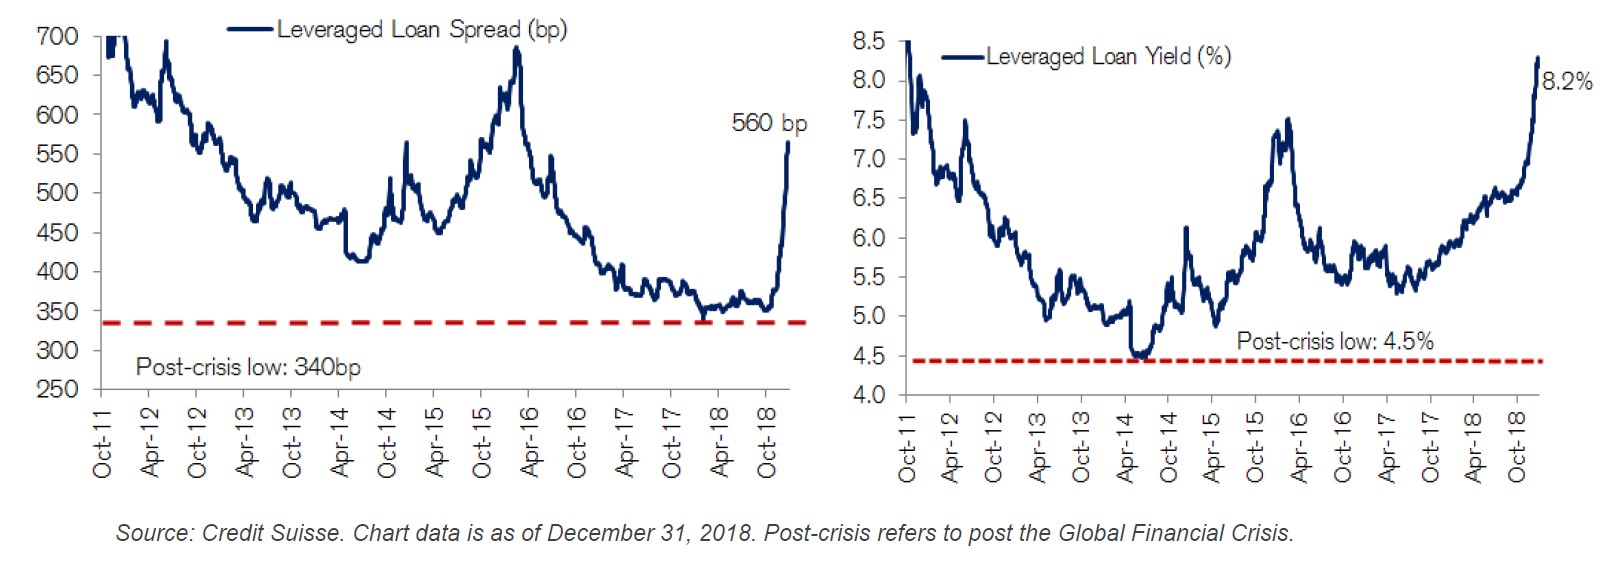
The decline in leveraged loan prices pushed the year-end spread on the index to its highest level since 2016. Coupled with higher Libor rates, the yield on the index reached its highest level since 2011 (see charts below).
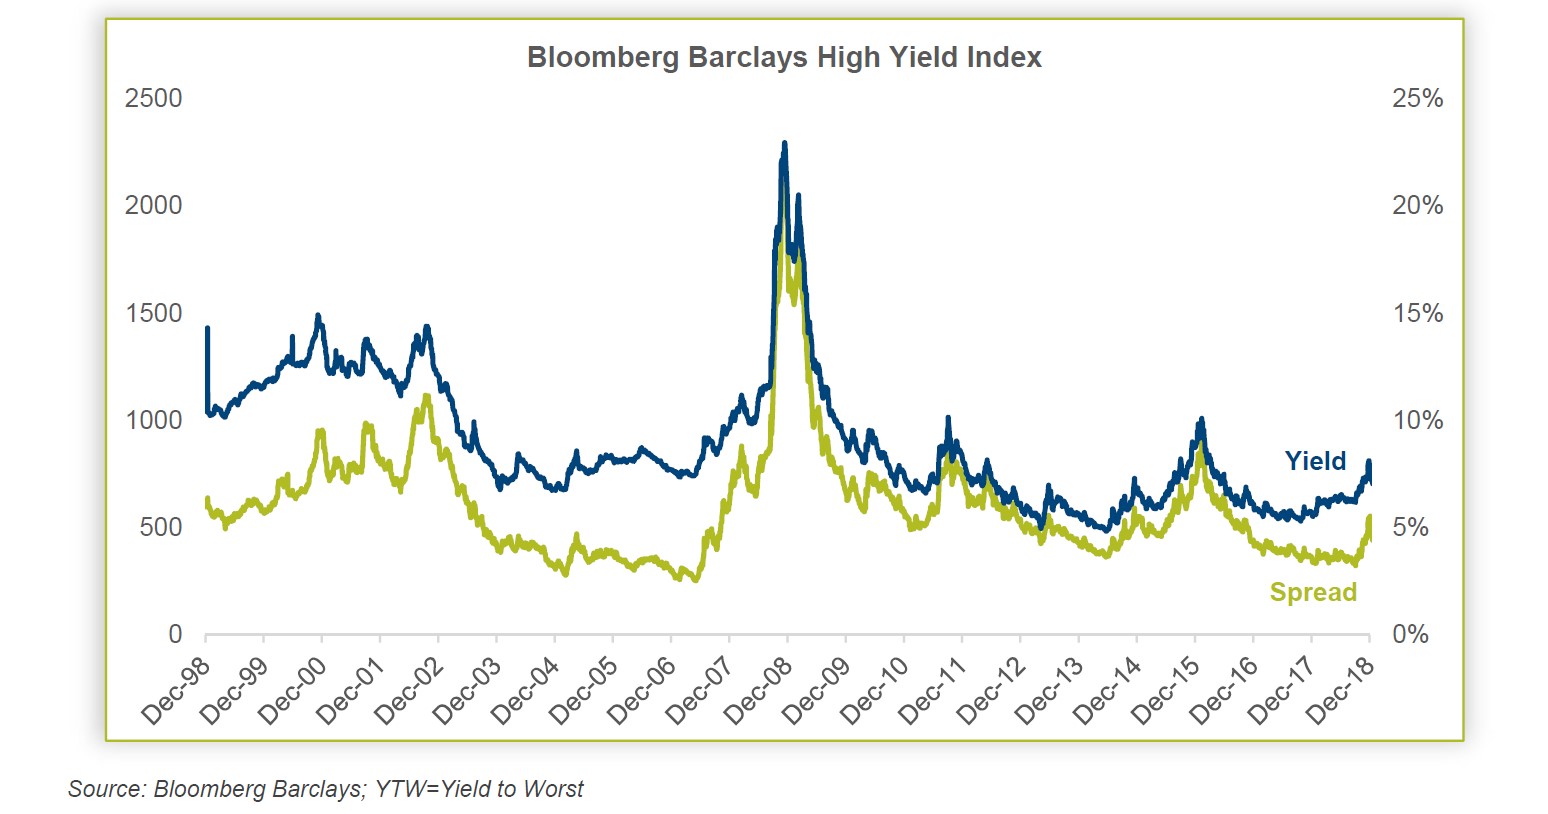
Similarly, high-yield index spreads and yields increased meaningfully, albeit from a low starting point, as shown in the chart below.
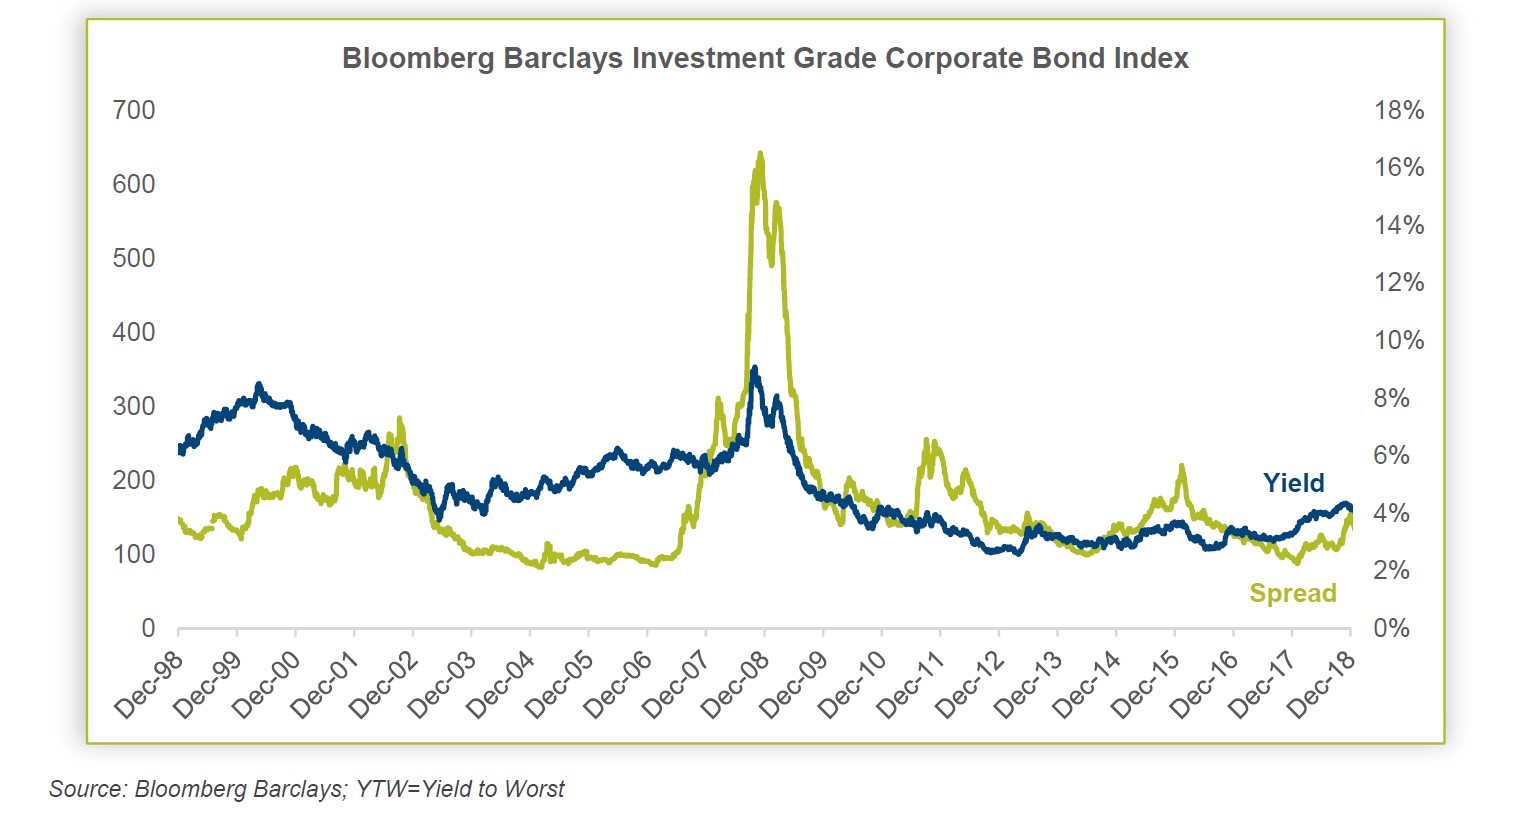
Spreads on the investment-grade corporate bonds were not immune from this sell-off. Those spreads rose meaningfully as well (again, from a low starting point), leading to the highest yields on that index since 2010.
As discussed in our recent special commentary “Risk is Where You Are Not Looking”, published January 2, 2019, the moves in corporate debt prices were not unexpected. We have long felt that corporate debt markets were overpriced. These recent price declines, though appearing significant on the surface, merely took those markets in our view from extremely expensive to expensive – and that was just a step toward what we consider fairly priced. Consistent with this view, for the past few years we reduced our exposure to investments rated BBB+ or lower. This reduction was done with an eye toward having less exposure to an expensive market and having more capacity to take advantage of attractive buying opportunities.
Treasury yields declined significantly during the fourth quarter, driven by a flight to quality and rising fears of recession. The moves were a reaction to the technical inversion of the yield curve and the Fed’s decision to raise short-term interest rates (which heightened recession concerns).
Throughout 2018, we took advantage of higher interest rates to extend the duration of the portfolio. Specifically, we discussed in prior commentaries a preference for longer-duration agency mortgages (greater than three years) over other high-quality non-agency bonds (including structured products and investment grade corporate bonds) because we were concerned about increasingly lower spreads (i.e., less compensation for credit risk) in non-agency bonds. We continued this investment theme into the fourth quarter – buying agency mortgage pools and reducing exposure to other non-agency high quality bonds (notwithstanding the aforementioned pause at the end of the year). Consequently, our exposure to agency mortgage pools increased during the quarter while our exposure to asset-backed securities (“ABS”) declined. Our ABS exposure declined due to a combination of amortization and maturities of existing holdings and the sale of short-duration holdings to fund new investments across the portfolio. Those reductions were partially offset by a few new investments in auto ABS, CLOs, insurance premium finance ABS and equipment ABS.
The other notable change in the portfolio was the slight decrease in corporate exposure, which includes high-quality investments rated greater than or equal to A- as well as credit investments rated less than A-. We took advantage of the sell-off in the high-yield and leveraged loan markets to add to existing high-yield and leveraged loan positions at attractive prices. We also initiated two new corporate credit investments. The purchases were offset by the sale of investment-grade corporate bonds early in the quarter, and declines in the market value of our remaining corporate loan and bond investments due to lower prices.
As a residual of our investment process, cash increased during the quarter. This increase reflects what we believe to be a meaningfully more expensive market for duration, net of a slightly more attractive market for credit.
Market Commentary
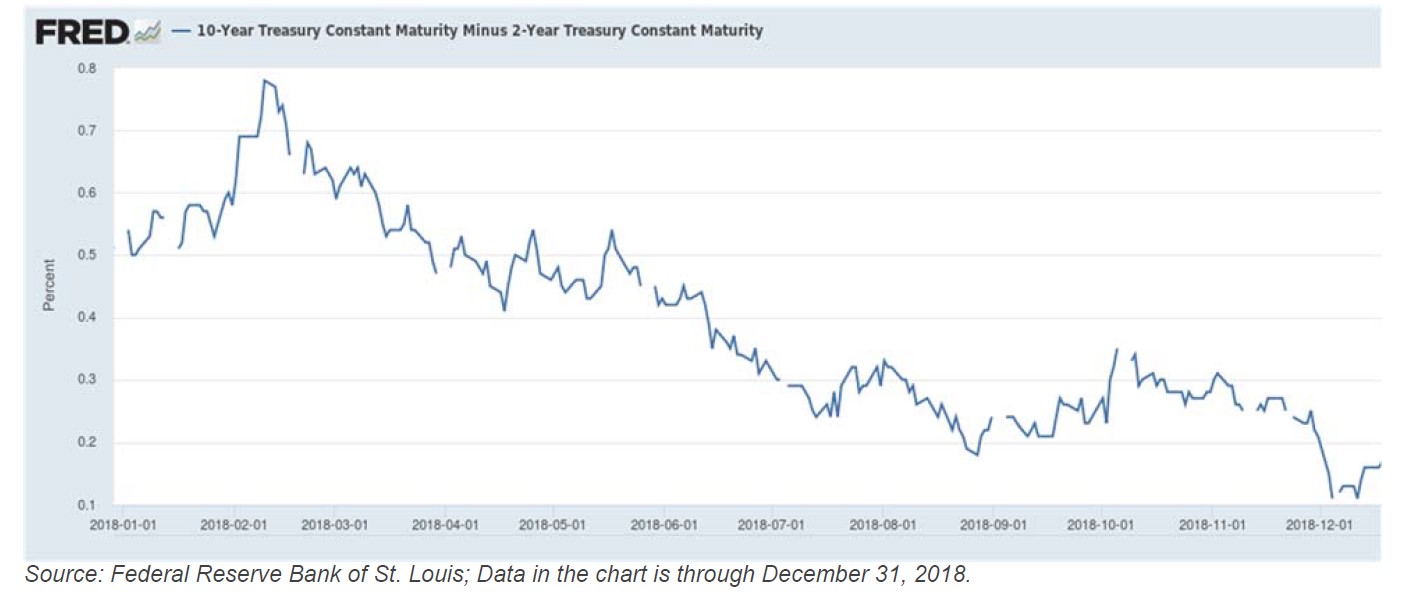
This year the shape of the yield curve has dominated capital market commentaries. While the shape of the yield curve often signals the next major direction of treasury interest rates, it does not predict the timing of that move. We discussed this in more detail in our Q4 2017 webcast. Historically, the economy has exhibited either a significant slowdown in growth or a recession one to two years after the difference in yield between the 10-year treasury and 2-year treasury reaches 50 basis points. Since the end of 2017, that difference in yield has continued to decline, as shown below.
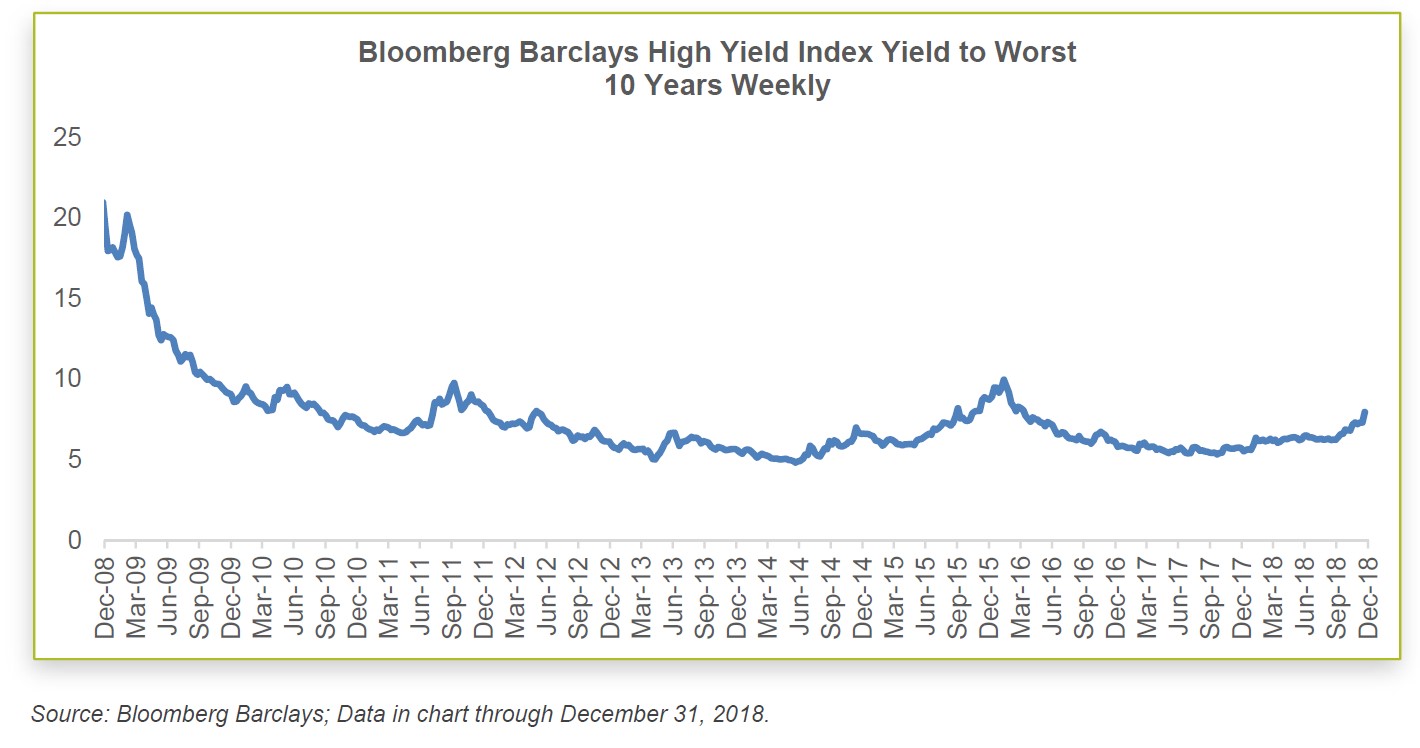
We commented at the end of 2017 that, historically, the yield-to-worst of the Bloomberg Barclays High-Yield Index started to increase within 12 months of the Treasury yield difference reaching 50 basis points. As the graph below illustrates, that increase has already begun.
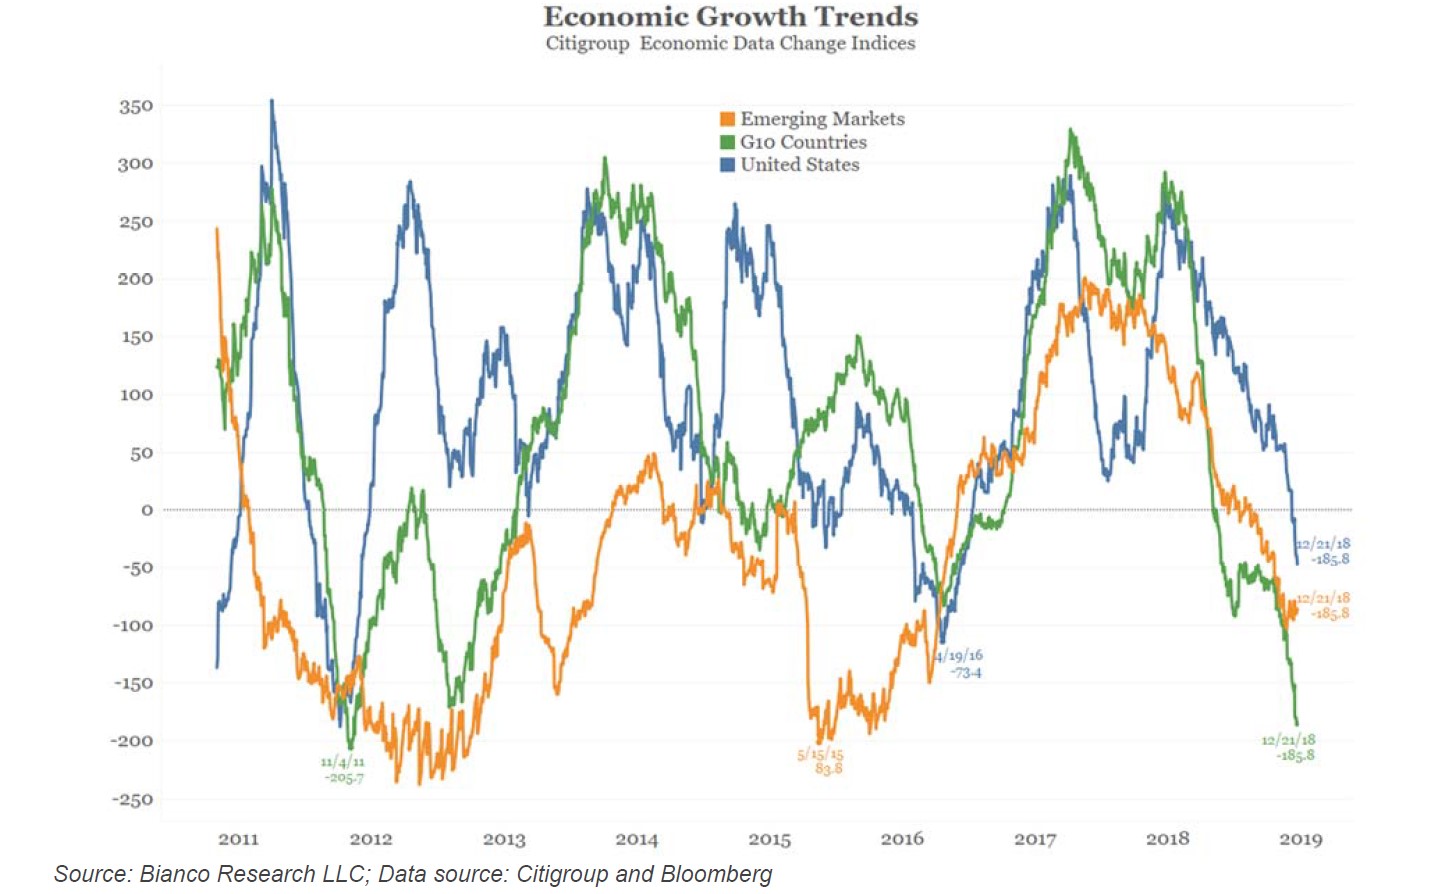
Economic data over the past year started out very strong based mostly on the corporate and personal income tax cuts. However, that benefit has been dissipating and we believe will continue to do so. Additionally, economic activity worldwide has tended to moderate. The graph below illustrates the rate of change in a variety of economic indicators for the United States, G10 countries (major developed countries) and emerging market countries. The graph compares the current monthly change compared to the average over the past 12 months. The Zero horizontal line represents growth equal to the 12 month average. The declining lines illustrate slowing economic growth. Whereas the emerging markets and G10 countries declined and grew less than the 12 month average (a negative reading) in early 2018, the United States did not replicate this pattern until late 2018. This data may not necessarily indicate that a recession is imminent in any of these economies but, at the very least, they show a marked decline in economic growth.
As an analytical team, we do not pretend to have an investable advantage in predicting economic growth, how many times the Federal Open Market Committee will change its interest rate forecast or economic views, or any of the myriad macroeconomic factors affecting the capital markets. We do not profess to have any analytical edge when it comes to how trade negotiations or Washington political infighting will affect bond markets and the economy in the short term—a recurring subject in the financial press. That said, there are certain indicators that cause us concern: the level of debt9, who is borrowing money, the relationship between debt and economic growth, and how repayment may affect future growth. We discuss these items and our concerns in the special commentary mentioned earlier (i.e., “Risk is Where You’re Not Looking”).
Given our long-held concerns discussed in “Risk is Where You’re Not Looking”, we wrote a separate commentary titled “Rare Bond Market Conditions Set Up Complacent Investors for Sub-Par Returns,” (published March 13, 2018), in which we made two statements that expressed our opinions that: 1) Longduration bonds do not offer sufficient incremental compensation versus short-duration bonds, and 2) Credit markets are expensive. We also noted that it is rare for both conditions to exist simultaneously. Our investment views at that time were for investors to shorten duration and reduce credit exposure. That decision has paid off since long-duration bonds and credit have underperformed.
With the probability of an economic recession increasing, and what we believe to be the diminished capacity to prop up weak fundamentals with more debt (sovereign or otherwise) and our concerns regarding the corporate debt market beginning to materialize, our focus is on liquidity and seeking high-quality investments that adequately compensate us for duration risk and recession risk, both on a short-term mark-to-market basis and long-term value basis. Beyond that, as always, we keep an eye out for attractive credit investments that market volatility may unearth.
New Fund
Over the years, some investors have expressed a desire for a version of the Fund that has the potential for greater long-term returns than the Fund and is suitable for investors with a longer time horizon and/or risk tolerance. After many years of consideration and research, on Dec. 31, 2018 we introduced a new fixed income strategy and launched a new mutual fund called FPA Flexible Fixed Income Fund (FPFIX).
Before launching this new fund, we had to ensure this endeavor would not disadvantage our existing Fund investors. With the additions to the investment team over the years as well as research into the capacity implications of running both funds, we believe we now have the resources in place to effectively execute this new strategy without negatively impacting the Fund.
Because FPA Flexible Fixed Income Fund is an outgrowth of investors’ interest in our absolute return approach to investing, the new strategy is more akin to a different expression of an existing strategy. Both funds have the same research team, process and philosophy. The Fund’s portfolio reflects what we believe to be the best investments we can assemble given its specific mandate, and we similarly believe that the new fund is the best portfolio we can create given its mandate and longer time horizon.
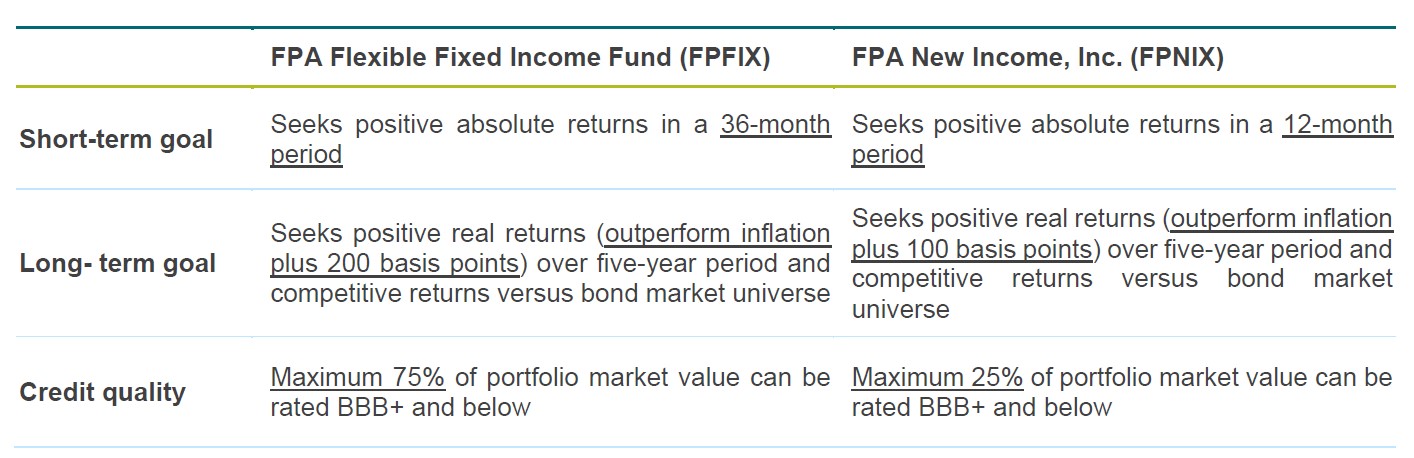
Specifically, as noted in the summary comparison below, the FPA Flexible Fixed Income Fund seeks a positive return over three years (rather than one year for the Fund). With this longer horizon, we seek to achieve a more attractive long-term return. We expect to achieve that result by utilizing its greater capacity for credit. Even so, the new fund will not always fully utilize its credit capacity. For both funds, our preference is to own credit only when it is priced to provide an attractive absolute return.
We believe the new fund is ideal for investors who have a longer investment time horizon and a higher tolerance for risk. That said, the FPA Flexible Fixed Income Fund is cast in the same absolute value mold as FPA New Income, Inc. Thus, while we expect the FPA Flexible Fixed Income Fund to achieve a higher long-term return profile than FPA New Income, we also expect it to exhibit similarly attractive risk-adjusted return metrics as FPA New Income.
Finally, please note that starting in 2019, both FPA New Income, Inc. and FPA Flexible Fixed Income Fund will be paying dividends on a monthly basis. For specific schedule, please refer to our website at: https://fpa.com/news-special-commentaries/fund-announcements/2019/01/24/2019-fpa-funds-dividendcalendar.
Thank you for your continued trust and support of First Pacific Advisors and its fixed income investment strategies.
Respectfully submitted,
Thomas H. Atteberry
Portfolio Manager
Abhijeet Patwardhan
Portfolio Manager
January 2019

