
Introduction
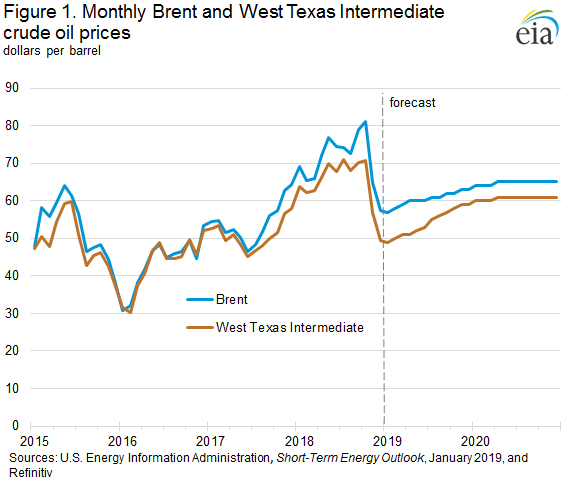
There are a lot of cross currents in the oil market right now with slowing growth in China and the United States from a Trade War, a prolonged government shutdown, Venezuela turmoil, and record domestic oil production in the United States. It should be no surprise that investors are worried about this commodity in their portfolios after having it drop from $77 a barrel in October to under $43 a barrel in December, that is entirely too much price volatility on a percentage basis than most investors can stomach. So, let us look at the latest EIA Inventory report for judging how the fundamentals are holding up right now.
Q4 hedge fund letters, conference, scoops etc
Oil Inventories
Crude oil stocks currently stand at 445 million barrels in storage facilities in the PADD Districts around the United States, this compares to 412 million barrels in storage a year ago. This reflects that in 2017 during the second half of the year we were in a supply deficit, but with the increased oil production year over year, and the effects of the Trade War with China, with China importing less US Oil, we were in a supply surplus during the second half of 2018, and especially after the summer driving season ended after labor day and refiners cut back run rates. The bulk of the added storage occurred in PADD 3 along the Gulf Coast moving from 205 million barrels in storage a year ago to 231 million barrels in storage currently. If China and the United States agree on a Trade Deal, China could start ramping up oil imports from the United States as part of the deal, and this would come out of the PADD 3 storage overhang.
Production Numbers
We next look at oil production, and it is still amazing to think how far the United States has come from when we were producing 4 million barrels per day in 2005 to where we are today at producing almost 12 million barrels of oil per day. Right now, US oil production stands at 11.9 million barrels per day versus 9.87 million barrels per day a year ago. This number is pretty crazy when you think about it, let us just round up to 9.9 million barrels of production last year, and this year we stand at 11.9 million barrels, this means we added another 2 million barrels per day of oil production on an annual basis, after already extended gains from the pullback to around 7.4 million barrels of oil production after the oil market crashed to $26 a barrel in February 2016. Yes, global oil demand led to demand growth of around 1.5 million barrels per year on average the last couple of years to offset some of these production gains, and Venezuela production continued to decline, but still in a vacuum this number is quite impressive.
Oil Imports
Moreover, Oil imports are roughly in line with year ago levels, slightly lower but not to a significant degree to reflect the massive increase in US Oil production. For example, if we look at the 4-week averages for US oil imports we currently stand at 7.74 million barrels per day versus 7.9 million barrels per day a year ago. This number is more volatile from week to week, so it is better to look at the trend in the data using the 4-week averages.
Gasoline Inventories
Moving on to the Gasoline side of the equation, this is where the real weaknesses in the oil supply chain start to show up. The gasoline market has been the weakest market in the products space for several years now. Total Gasoline stocks currently stand at 260 million barrels across the PADD Districts versus an already elevated level of supplies at 244 million barrels this time last year. In fact, this is the all-time high in Gasoline Inventories if we look back through the historical data as we spiked to 251 million barrels in storage in March of 1990. We have been steadily climbing in gasoline inventories, putting in higher lows and higher highs since around 2012. And this is just late January, we usually continue to build in gasoline inventories through February at the very least, so expect some more record highs in this category. In looking at the year over year increases in gasoline inventories, the PADD Districts that stand out are the East Coast PADD 1 at 68 million barrels versus 63 a year ago, the Midwest PADD 2 at 61 million barrels versus 55 a year ago, and the Gulf Coast PADD 3 at 91 million barrels in storage versus 84 a year ago.
Gasoline Demand
If we examine gasoline demand the numbers are basically the same as last year, and taken in context with the latest Employment Report, the economy is still relatively strong, and not completely falling off a cliff like in 2007/08 as the Financial Crisis worsened economic conditions sending the United States into recession. That being said, there are still headwinds for the economy with the US being in the late stages of a decade long strong business cycle, higher interest rates, a Trade War with Tariffs, and US Political gridlock which continues to put a damper on economic growth in the United States.
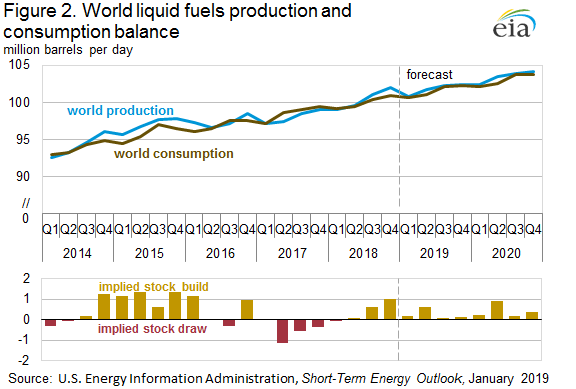
The growing inventories in Oil and Petroleum Products can be explained in some sense due to larger global use of supplies daily. In short, the world uses more Oil and Petroleum Products every day, so the law of large numbers necessitates that we keep more in storage in the supply chain. But on the other hand, since we produce and refine so much oil and products domestically each day compared to the past, an argument can be made for not needing as much inventory in storage for supply chain logistics. The one thing that is clear right now, is that the United States needs a strong export market for both gasoline and oil given the current levels of production and inventories in order to justify a higher price for these commodities. If the Global economy continues to slow down, and we enter a Global Recession, then US Oil Production needs to be reduced dramatically at these record high levels.
Distillates Inventories
Let us check out the Distillates Market where we currently stand at 142 million barrels in storage versus 140 a year ago. The numbers are about the same as last year, however the rise in Distillates stocks the last 6 weeks has been rather dramatic, and points to considerably more weakness than a year ago where there was a much more gradual rise in inventories. Pay attention to the Distillates number for the next 6 weeks, if we continue to build rather dramatically, this is extremely bearish for the overall economy, reflecting weak industrial growth and global trade, and the oil market in general. The Distillates Market has been the strongest sector of the energy space the last couple of years, reflecting strong global growth, overall business activity, and industrial demand drivers.
Distillates Production
In examining the Total Distillates Production numbers in the 4-week averages we are producing about 250,000 to 300,000 more barrels per day than a year ago. While at the same time Distillates Demand is about 150,000 to 200,000 below year ago levels based upon the 4-week averages of the last three weekly reports. Thus, the dramatic rise in Distillates inventories, and something to pay attention to going forward.
In Summary
In summary, the Oil Market bottomed out at $42.60ish in December, along with equities that were both oversold, and had a substantial short covering positioning rally in both asset classes. The Oil Market has been trading right in lock step with equities since the 4th quarter of 2018, and the first quarter of 2019 on global growth concerns. When bad news comes out regarding the China Trade War, or Economic Growth concerns spike both equities and oil sell off together in the same correlated trade in financial markets. However, the Oil Market has a lot of moving parts to it from US domestic production, to the continued growth of Emerging Markets from a long-term perspective, to the Geopolitical instability in the Middle East.
It will be important to follow the data to examine whether Oil and Petroleum inventories continue to rise despite the recent OPEC cutbacks as we move through the seasonally weak part of the Oil Market through February. But if we are continuing to experience weakness in the demand numbers come mid-March and late April as Refiners start ramping up for the summer driving season, then expect further weakness in the Oil Markets. In addition, if there is no Trade Deal with China, and the Global economy deteriorates further, there will be considerably more pain in the energy space, both from a credit, equity, and commodity perspective. When the Oil Futures price falls, energy credit risk spikes, and energy equity prices fall as well in the financial markets.
Longer Term Forecast
Longer term though I am rather bullish on Oil, and I think there is a considerable chance of a substantial spike to new record levels in price sometime over the next 10 years. Thus, any historical crash in oil prices in the near term should be bought with plenty of holding liquidity for long term investors looking to speculate far out on the futures curve. As Russia, Saudi Arabia and the United States have rather limited upside spare capacity, and are all pumping at record levels of production currently, and where I expect Global growth to be over the next decade, with the caveat of no significant long-term global recession, I expect the world to need more oil, much more than producers have the ability to produce given the Cap Ex investment of the last 5 years. Thus, on a forward-looking basis, I expect there is a good possibility of an oil supply crunch, where the oil market tightens much further than the current futures curve or energy analysts have priced in or modeled over the next decade in the oil market.
© EconMatters.com All Rights Reserved | Facebook | Twitter | YouTube | Email Digest

