
Oh my! What a difference a few months makes. Originally, what looked like an economic glass half empty in December has turned into a new record glass half full. What looked like Armageddon in December has turned into a v-shaped bed of roses to new all-time record stock market highs for the S&P 500 index (see chart below). For the recent month, the S&P 500 climbed another +3.9% to 2,945, bringing total 2019 gains to an impressive +17.5% advance. Before you get too excited, it’s worth noting stocks were down in value during 2018. When you combine 2018-2019, appreciation over the last 16 months equates to a more modest +10.2% expansion. Worth noting, since the end of 2017, profits have climbed by more than +20%, which means stocks are cheaper today as measured by Price-Earnings ratios (P/E) than two years ago (despite the historic, record levels). For any confused investors, we can revisit this topic for discussion in a future writing.
Q1 hedge fund letters, conference, scoops etc
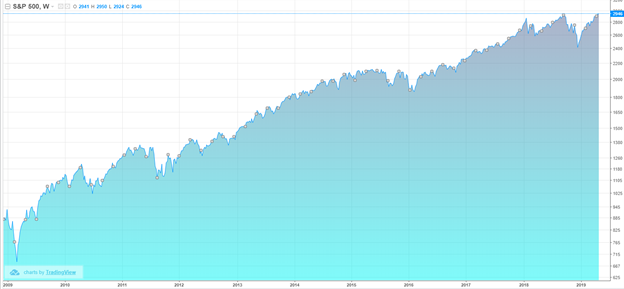
Source: Trading Economics
From Famine to Feast
As I noted in my “December to Remember” article, there were no shortage of concerns ranging from impeachment to Brexit. How do those concerns look now? Let’s take a look:
Government Shutdown: The longest government shutdown in history (35 days) ended on January 25, 2019 with minimal broad-based economic damage.
Global Trade (China): Rhetoric coming from President Trump and his administration regarding a trade deal resolution with China has been rather optimistic. In fact, a CNBC survey shows 77% of respondents believe that the U.S. and China will complete a trade deal.
Federal Reserve Interest Rate Policy: After consistently increasing interest rates nine times since the end of 2015 until late 2018, Federal Reserve Chairman Jerome Powell signaled he was effectively taking monetary policy off rate-hiking “autopilot” and would in turn become “patient” as it relates to increasing future interest rates. Interestingly, traders are now forecasting a 70% chance of a rate cut before January 29, 2020.
Mueller Investigation: Special counsel Robert Mueller released his widely anticipated report that investigated Russian collusion and obstruction allegations by the president and his administration. In Mueller’s 22-month report he could “not establish that members of the Trump Campaign conspired or coordinated with the Russian government in its election interference activities.” As it relates to obstruction, Mueller effectively stated the president attempted to obstruct justice but was not successful in achieving that goal. Regardless of your political views, uncertainty surrounding this issue has been mitigated.
New Balance of Power in Congress: Democrats took Congressional control of the House of Representatives and reintroduced gridlock. But followers of mine understand gridlock is not necessarily a bad thing.
Brexit Deal Uncertainty: After years of negotiations for Britain to exit the European Union (EU), the impending Brexit deadline of March 29th came and went. EU an UK leaders have now agreed to extend the deadline to October 31st, thereby delaying any potential negative impact from a hard UK exit from the EU.
Recession Fears: Fears of a fourth quarter global slowdown that would bleed to a recession on U.S. soil appear to have been laid to bed. The recently reported first quarter economic growth (Gross Domestic Product – GDP) figures came in at a healthy+3.2% annualized growth rate, up from fourth quarter growth of +2.2%, and above consensus forecasts of 2.0%.
Curve Concern
The other debate swirling around the investment community this month was the terrifying but wonky “inverted yield curve.” What is an inverted yield curve? This is a financial phenomenon, when interest rate yields on long-term bonds are lower than interest rate yields on short-term bonds. Essentially when these dynamics are in place, bond investors are predicting slower economic activity in the future (i.e., recession). The lower future rates effectively act as a way to stimulate prospective growth amid expected weak economic activity. Furthermore, lower future rates are a symptom of stronger demand for longer-term bonds. It’s counterintuitive for some, but higher long-term bond prices result in lower long-term bond interest rate yields. If this doesn’t make sense, please read this. Why is all this inverted yield curve stuff important? From World War II, history has informed us that whenever this phenomenon has occurred, it has been a great predictor for a looming recession.
As you can see from the chart below, whenever the yield curve (red line) inverts (goes below zero), you can see that a recession (gray vertical bar) occurs shortly thereafter. In other words, an inverted yield curve historically has been a great way to predict recessions, which normally is almost an impossible endeavor – even for economists, strategists, and investment professionals.
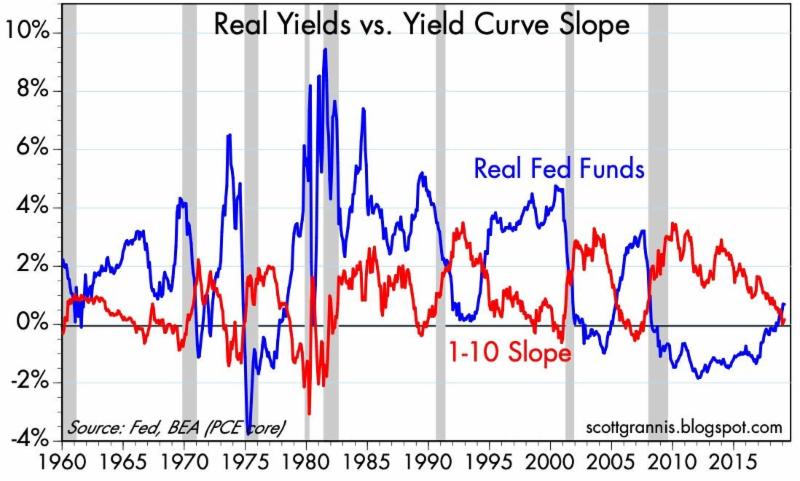
Source: Calafia Beach Pundit
Although the curve inverted recently (red line below 0), you can see from the chart, historically recessions (gray vertical bars) have occurred only when inflation-adjusted interest rates (blue line) have climbed above 2%. Well, the data clearly shows inflation-adjusted interest rates are still well below 1%, therefore an impending recession may not occur too soon. Time will tell if these historical relationships will hold, but rest assured this is a dynamic I will be following closely.
It has been a crazy 6-9 months in the stock market with price swings moving 20% in both directions (+/-), but it has become increasingly clear that a multitude of 2018 fears causing the glass to appear half empty have now abated. So long as economic growth continues at a healthy clip, corporate profits expand to (remain at) record levels, and the previously mentioned concerns don’t spiral out of control, then investors can credibly justify these record levels…as they peer into a glass half full.
Wade W. Slome, CFA, CFP®
Plan. Invest. Prosper.
This article is an excerpt from a previously released Sidoxia Capital Management complimentary newsletter (May 1, 2019). Subscribe on the right side of the page for the complete text.
DISCLOSURE: Sidoxia Capital Management (SCM) and some of its clients hold positions and certain exchange traded funds (ETFs), but at the time of publishing had no direct position in any other security referenced in this article. No information accessed through the Investing Caffeine (IC) website constitutes investment, financial, legal, tax or other advice nor is to be relied on in making an investment or other decision. Please read disclosure language on IC Contact page.
Article by Investing Caffeine

