
ETFGI reports assets invested in ETFs and ETPs listed globally reached a record of US$5.25 trillion at the end of September 2018
Q3 hedge fund letters, conference, scoops etc
LONDON — October 15, 2018 — ETFGI, a leading independent research and consultancy firm covering trends in the global ETF/ETP ecosystem, reported today that assets invested in ETFs and ETPs listed globally reached a new high of US$5.25 trillion, following net inflows of US$52.18 billion and market moves during September. The trend towards products providing exposure to the US continued, with equity based products tracking the core US indices seeing substantial inflows, according to ETFGI’s September 2018 Global ETF and ETP industry landscape insights report, an annual paid-for research subscription service. (All dollar values in USD unless otherwise noted.)
Highlights
- Total Assets in ETFs and ETPs listed globally reached a record $5.25 Tn in September.
- Net new assets gathered by ETFs/ETPs listed globally were $52.18 Bn in September.
- 56th consecutive months of net inflows into ETFs/ETPs listed globally.
“Developed markets were broadly up during September following positive economic data from the US, Japan and Eurozone, despite the US-China trade dispute and on-going political tension in Europe. Developed Markets ex-US gained 0.68% during the month while the S&P 500’s winning streak tapered off, gaining only 0.57%, with mid to small cap US equities closing down. Developing markets downward trend continued, with EM markets down 1.37% and Frontier markets down 0.18%, bringing year to date declines to 8.08% and 7.56%, respectively.” according to Deborah Fuhr, managing partner and a founder of ETFGI.
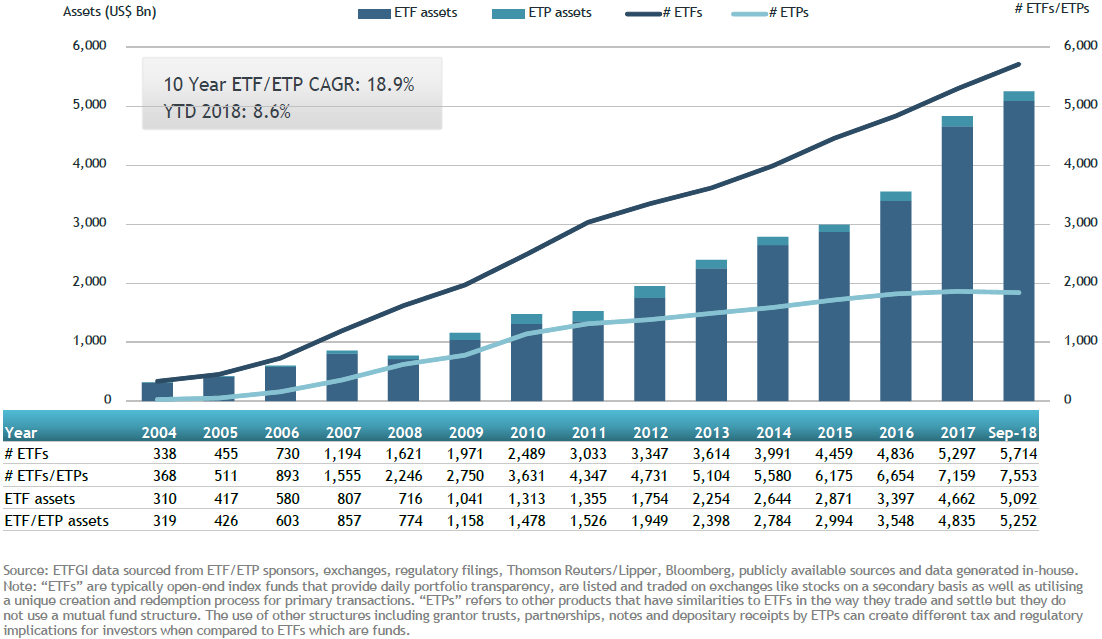
At the end of September 2018, the Global ETF/ETP industry had 7,553 ETFs/ETPs, with 14,643 listings, assets of $5.25 Tn, from 386 providers listed on 69 exchanges in 57 countries. Following net inflows of $52.18 and market moves during the month, assets invested in ETFs/ETPs listed globally increased by 0.44%, from $5.23 Tn in August 2018 to $5.25 Tn.
Growth in Global ETF and ETP assets as of the end of September 2018
Equity ETFs/ETPs listed globally attracted net inflows of $45.04 Bn in September, bringing net inflows for 2018 to $251.28 Bn, less than the $327.30 Bn in net inflows at this point last year. Fixed Income ETFs and ETPs listed globally gathered net inflows of $7.24 Bn in September, growing net inflows for 2018 to $74.10 Bn, considerably less than the $121.83 Bn in net inflows at this point last year.
September marked the 56th consecutive month of net inflows into ETFs/ETPs listed globally, Year-to-date in 2018 there have been net inflows of $351 Bn, less than the $483 Bn in net inflows at this point last year.
Substantial inflows during September can be attributed to the top 20 ETFs by net new assets, which collectively gathered $30.1 Bn. The SPDR S&P 500 ETF (SPY US) gathered $5.01 Bn, the largest net inflow in September.
Top 20 ETFs by net new assets September 2018: Global
| Name | Ticker | Assets (US$ Mn) Sep-18 |
ADV (US$ Mn) Sep-18 |
NNA (US$ Mn) YTD 2018 |
NNA (US$ Mn) Sep-18 |
| SPDR S&P 500 ETF Trust | SPY US | 279,360 | 16,975 | (13,065) | 5,009 |
| Vanguard S&P 500 ETF | VOO US | 104,429 | 619 | 12,435 | 4,543 |
| iShares Russell 2000 ETF | IWM US | 49,840 | 2,664 | 3,172 | 2,490 |
| TOPIX Exchange Traded Fund | 1306 JP | 77,349 | 32 | 17,033 | 2,472 |
| iShares 20+ Year Treasury Bond ETF | TLT US | 9,182 | 891 | 2,639 | 1,652 |
| Communication Services Select Sector SPDR Fund | XLC US | 2,035 | 103 | 2,031 | 1,526 |
| iShares Core MSCI EAFE ETF | IEFA US | 59,977 | 399 | 19,911 | 1,202 |
| Listed Index Fund TOPIX | 1308 JP | 34,144 | 6 | 6,521 | 1,201 |
| Nikkei 225 Exchange Traded Fund | 1321 JP | 55,934 | 70 | 5,543 | 1,194 |
| Vanguard Total Stock Market ETF | VTI US | 105,500 | 297 | 5,974 | 1,147 |
| Daiwa ETF TOPIX | 1305 JP | 36,915 | 4 | 8,507 | 1,072 |
| Health Care Select Sector SPDR Fund | XLV US | 19,632 | 577 | 672 | 861 |
| Vanguard FTSE Developed Markets ETF | VEA US | 71,267 | 299 | 5,494 | 823 |
| First Trust NYSE Arca Biotechnology Index Fund | FBT US | 3,122 | 85 | 1,519 | 782 |
| iShares J.P. Morgan USD EM Bond ETF | EMB US | 14,522 | 347 | 3,185 | 772 |
| ChinaAMC China 50 ETF | 510050 CH | 6,014 | 234 | 842 | 709 |
| Vanguard Mid-Cap ETF | VO US | 25,308 | 54 | 1,990 | 682 |
| iShares Broad USD Investment Grade Corp Bond ETF | USIG US | 2,171 | 36 | 708 | 670 |
| iShares iBoxx $ Investment Grade Corp Bond ETF | LQD US | 33,955 | 675 | (3,146) | 666 |
| Listed Index Fund 225 | 1330 JP | 28,266 | 21 | 1,811 | 628 |
Similarly, the top 10 ETPs by net new assets collectively gathered $1.16 Bn by the end of September 2018.
Top 10 ETPs by net new assets September 2018: Global
| Name | Ticker | Assets (US$ Mn) Sep-18 |
ADV (US$ Mn) Sep-18 |
NNA (US$ Mn) YTD 2018 |
NNA (US$ Mn) Sep-18 |
|
| VelocityShares Daily 3x Inverse Natural Gas ETN | DGAZ US | 504 | 142 | 308 | 224 | |
| iPath S&P 500 VIX Short-Term Futures ETN | VXX US | 1,067 | 799 | (188) | 167 | |
| iShares Gold Trust | IAU US | 10,212 | 130 | 1,086 | 159 | |
| Invesco Gold ETC | SGLD LN | 4,149 | 4 | (137) | 140 | |
| SPDR Gold MiniShares Trust | GLDM US | 229 | 13 | 210 | 117 | |
| VelocityShares 3x Inverse Crude Oil ETN | DWT US | 220 | 50 | 171 | 90 | |
| Shinhan Investment K200 Enhanced Condor 4/10% ETN 39 | 500039 KS | 90 | 0 | 89 | 89 | |
| BNP Paribas RICI Enhanced BRENT Oil (TR) ETC | BNQC GY | 96 | 0 | 80 | 80 | |
| iShares Silver Trust | SLV US | 4,762 | 114 | 193 | 47 | |
| FI Enhanced Global High Yield ETN | FIHD US | 1,530 | 3 | 377 | 46 | |
Investors have tended to invest in core, market cap and lower cost ETFs in September.

