
In their latest Q3 2022 Quarterly Letter, GMO explain why U.S Deep Value (Cheapest 20%) is very cheap. Here’s an excerpt from the letter:
But while the halves of the market are a natural way to break things up from a style perspective, they can hide some important distinctions. In our Equity Dislocation Strategy we differ from the global style indices in a number of ways.
Q3 2022 hedge fund letters, conferences and more
 We are much closer to equal weighting than capitalization weighting, we limit the size of our sector and industry bets between longs and shorts, and we focus much more heavily on the most extremely cheap and overvalued segments of the market rather than simply looking at the cheap and expensive 50%.
Over 80% of the long and short sides of our strategy are in the cheapest and most expensive 20% of the universe, so it is natural for us to want to look at the quintiles of valuation rather than the halves. Exhibit 2 shows quintiles of valuation in the U.S.
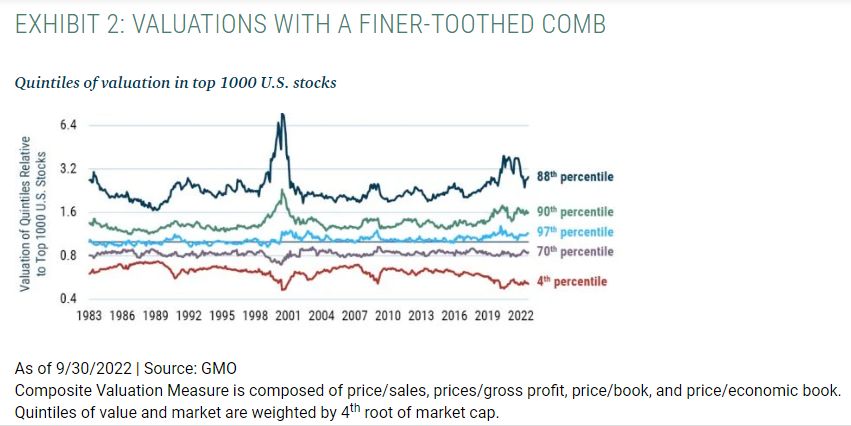
While the five different lines of this chart make it a little busy, we can immediately see several interesting features of the U.S. market today. On the expensive end (noted by the dark blue line), the valuation of the very most expensive stocks has indeed come down relative to the rest of the market.
They peaked out trading around 4 times the valuation of the average company and are now trading around 3 times. That is still one of the more extreme valuations of the last 40 years, scoring as the 88th percentile valuation versus history.
The rest of the growth universe is less expensive relative to the market but, if anything, a bit more expensive relative to its own history, at the 90th percentile.
On the value end of things, however, the story isn’t quite so simple. The cheapest 20% of the market (in red) is very cheap indeed, still trading at the 4th percentile versus history. But the rest of the value universe is much less attractively positioned, with the next quintile at the 70th percentile and the “middle” quintile of stocks that are neither particularly value-y or growth-y at just about its most expensive valuation in history.
For the purposes of our Equity Dislocation Strategy, nothing in this chart is particularly concerning. While the opportunity in the most expensive tier of stocks is less extreme than it was, it is still the group that seems worth focusing our short book on, whereas the long side gives us every reason to be focusing almost exclusively on this cheapest quintile of stocks.
But the pattern within value is an intriguing one that does have some meaningful implications for long-only portfolios. Looked at in this way, it seems as if a value strategy in the U.S. should be avoiding the “shallow value” stocks that are mildly cheap relative to the market and focusing solely on the “deep value” quintile.
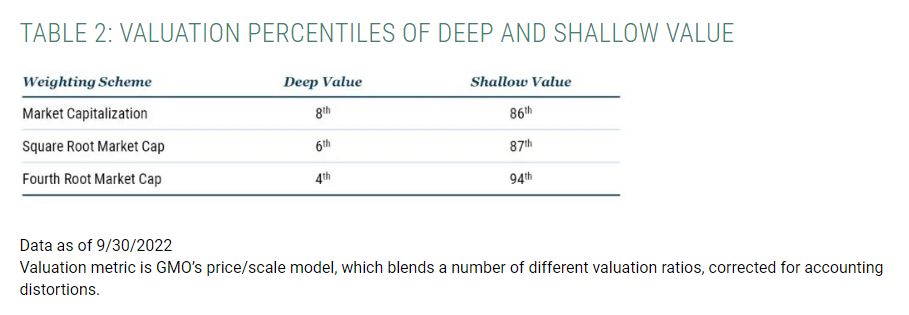
But the version of this that is most relevant for a long/short that is close to equal weighting within the large cap universe is not necessarily the version you’d be most interested in for a long-only portfolio.
But what we see across different weighting schemes is that the pattern is pretty similar whether we are using the weighting scheme most relevant to a long/short (at least the way we tend to run our long/shorts) or ones that are more relevant to long-only portfolios. The percentile ranking of the cheapest 20% of the market against the percentile ranking of the next 30% of the market is shown in Table 2.
You can read GMOs entire Q3 2022 Letter here:
For all the latest news and podcasts, join our free newsletter here.
Article by The Acquirer’s Multiple.

