
Based on the improved performance metrics, which we recently added to our stock screens, the following company may be a value stock:
Q4 2021 hedge fund letters, conferences and more
Moderna Inc (NASDAQ: MRNA)
Moderna is a commercial-stage biotech that was founded in 2010 and had its initial public offering in December 2018. The firm’s mRNA technology was rapidly validated with its COVID-19 vaccine, which was authorized in the United States in December 2020. Moderna had 44 mRNA development programs as of early 2022, with 25 of these in clinical trials. Programs span a wide range of therapeutic areas, including infectious disease, oncology, cardiovascular disease, and rare genetic diseases.
A quick look at the share price history for the company (below) over the past twelve months shows that the price is up 3%.
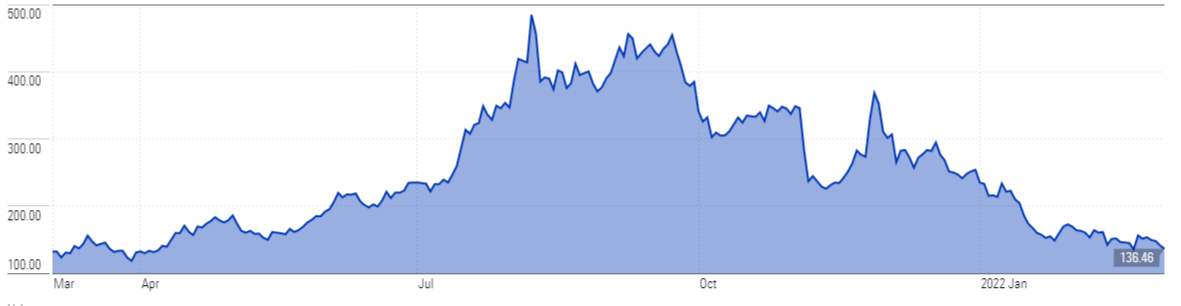 Even though the company has a market cap of $55 Billion and a price of $136.46, here’s why the company may be a value stock:
Bubble Map
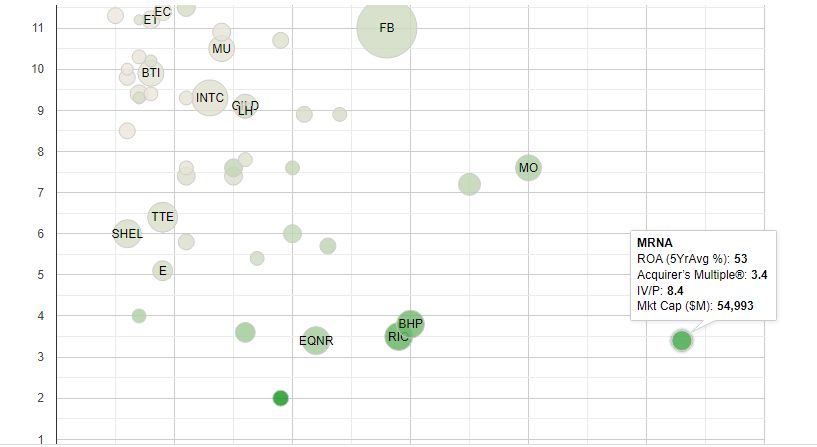
Implied Value To Price
8.4
IV/P or Intrinsic Value to Price: This column compares the stock’s Implied Value (Earning Power, Incremental Growth plus Shareholder Yield)to the current price. The number represents the value offered for each dollar invested. IV/P greater than one (1) indicates that each dollar invested receives more than $1 of Intrinsic Value. IV/P less than one indicates less than $1 of Intrinsic Value for each dollar invested. The IV/P is necessarily a rough estimate. These stocks benefit from mean reversion in multiples, and no mean reversion in fundamentals. Where the market is applying a lower Acquirers Multiple to a stock’s Expected Return, it may indicate an undervalued opportunity. This is a profitability-at-a-reasonable price screen. Historically, getting more an IV/P lower than about 0.6–each dollar invested buys 60 cents or less of Intrinsic Value–is overvalued.
—
Acquirer’s Multiple
3.4
Acquirers Multiple: Ranking on this column shows the stocks with the lowest multiples in the universes. These are deep value stocks that may benefit from mean reversion in the underlying businesses. This is the traditional deep value screen.
—
Expected Return (%)
55.05
E(r) or Expected Return (%): The sum of a stock’s Earning Power, Incremental Growth and Shareholder Yield. This is a variation of Bruce Greenwald’s calculation. It assumes no mean reversion in multiples or fundamentals.
—
Return On Assets (5YAvg%)
53
ROA or Return on Assets: Ranking on this column shows the stocks with the highest five-year average operating income returns on total assets. These are the most profitable companies in the universes over the last five years.
—
Incremental Growth (%)
1
Incremental Growth (%): This is the reinvestment rate (capital expenditures less depreciation divided by total assets) multiplied by ROA. It can be positive–if cap ex exceeds depreciation–or negative–if cap ex falls short of depreciation. Companies with a high reinvestment rate and a high ROA will score higher on the Incremental Growth metric. Low or negative reinvestment rates and a low ROA will score lower on the Incremental Growth metric.
—
FCF Yield (%)
24.22
FCF Yield or Free Cash Flow Yield: Trailing Twelve-Month Free Cash Flow divided by Market Capitalization. Another traditional deep value screen. These stocks benefit from mean reversion in fundamentals and multiples.
—
Shareholder Yield (%)
1.33
Buyback Yield, Dividend Yield, and Shareholder Yield show the stocks with the highest payout ratios.
For all the latest news and podcasts, join our free newsletter here.

