
Advisors who use Dimensional funds are generally believed to more likely adhere to their investment strategies than their peers. A comparison of fund and investor returns calls this conventional wisdom into question.
I chose to analyze the oldest small-cap value fund because the last 15 years haven’t been kind to that asset sub-class. As of May 6, 2022, Morningstar shows Dimensional Fund Advisors Small Cap Value Fund (DFSVX) averaged 6.69% annual returns, lagging the 9.04% performance of Vanguard’s Total Stock Fund (VTSAX). That translates to 164% cumulative growth for the Dimensional fund and 266% for the Vanguard fund.
Q1 2022 hedge fund letters, conferences and more

Whenever I write about the relative performance of funds, I get comments like, “If you go back longer, DFSVX has bested the total-stock fund by three percentage points annually.” But were investors as a whole better off with the Dimensional fund?
I asked Morningstar to run the numbers since inception of the Dimensional fund on May 2, 1993. Its data went back to the beginning of 1995. Did Dimensional investors outperform since then? Though the answer is a resounding “no,” my research also uncovered some behavioral traits of the advisors who control those funds (for the most part, Dimensional’s mutual funds can only be purchased through an advisor and not directly by retail investors). Shockingly, since inception, more funds have flowed out of DFSVX than in.
A primer: Fund and investor returns
The return of any fund is the geometric annual average growth. The investor return is the internal rate of return one gets on their money. A simple illustration is as follows:
An investor puts $50,000 in a fund and earns a 30% return in year one. Feeling confident, she puts an additional $450,000 in that fund at the end of that year. But then the fund declines by 10%. The fund itself earned an 8.87% annualized return but the investor lost $36,500 or a negative 6.68% annually.
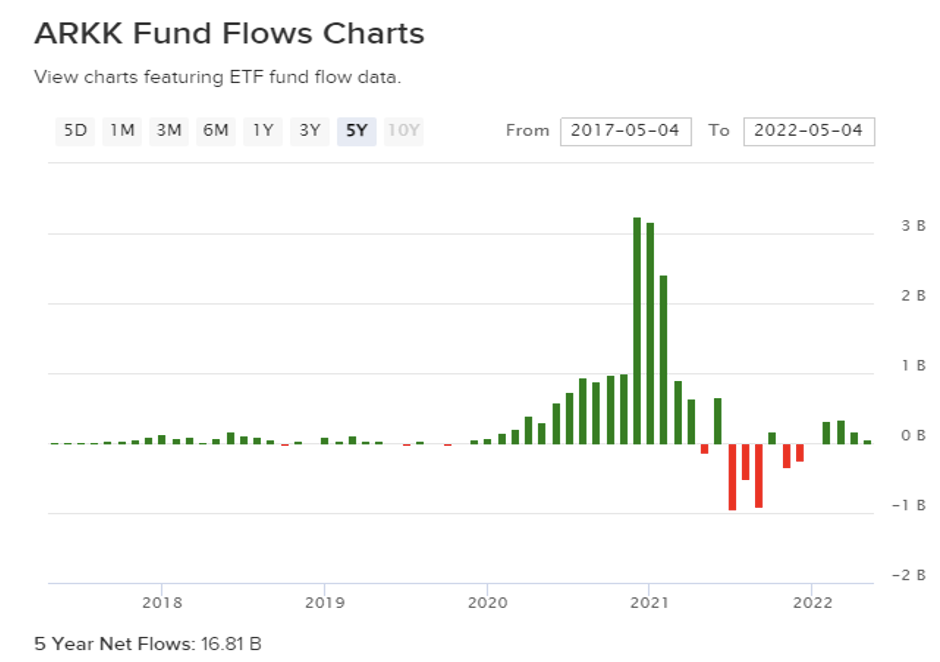
Before applying this to the Dimensional fund, let’s look at a real-world example that has been in the news lately – Cathie Wood’s ARK Innovation Fund (ARKK). FactSet’s Elisabeth Kashner calculated that since inception on October 30, 2014, Wood bested the Vanguard Total Stock Fund by 2.33% annually through May 3, 2022. Yet the average investor lagged by 2.45% annually.

The large difference between these two numbers is illustrated in the following Morningstar chart comparing ARKK to the ETF share class of the Vanguard Total Stock Market Fund (VTI). ARKK performed spectacularly until the last year and a half. Billions of dollars poured in just in time for its dismal performance; the fund had far more money when it underperformed. To its investors’ credit, however, money has not poured out, as investors appear more disciplined, at least for the time being.

Below you can see the flows into the ARKK fund, according to ETFDB.com.
Applying this to DFSVX versus VTSAX returns
It would be inappropriate to compare Dimensional’s relatively low-cost and academically based Fama French design to a recent hot fund that turned ice cold. And Dimensional itself has said for some time that factors can underperform for long periods of time. But the principle of investor and fund returns still applies.
Morningstar Direct was able to go back to the beginning of 1995 (not too long after its 1993 inception) and obtain both fund and investor returns. To compare, I used the oldest of the total U.S. stock funds – the Vanguard Total Stock Index Fund. I started with the VTSMX investor share class but then switched to the lower cost VTSAX share class the first year it was available. Investor-return data was available only through the end of 2021.
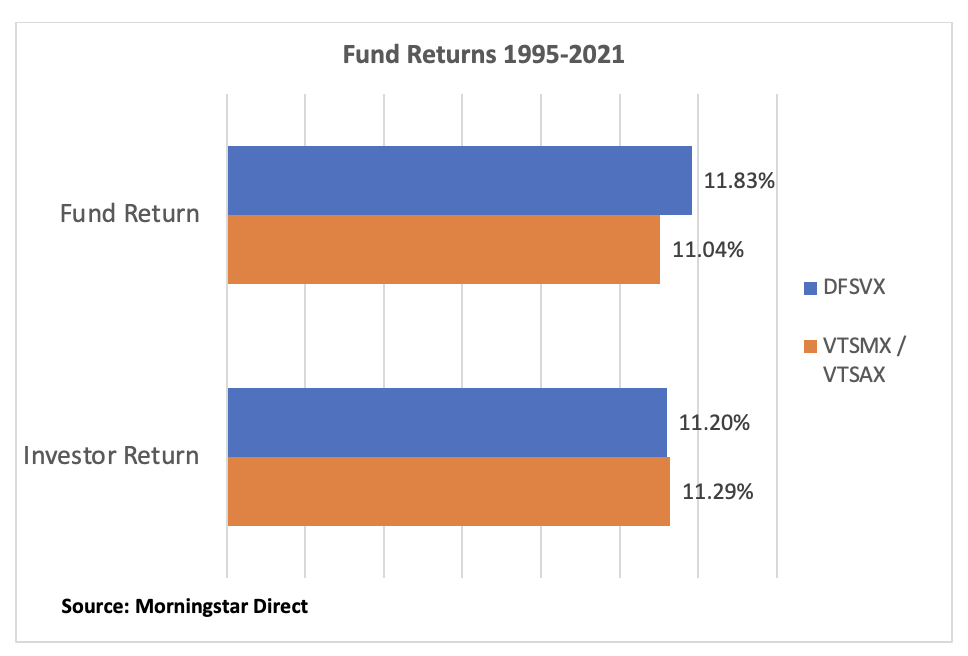
Though the returns differed by only 79 basis points, over 27 years of compounding, a $10,000 investment in DFSVX grew to $194,680 versus only $159,023 for the cap-weighted Vanguard fund. But investors, on average, did better with the Vanguard Total Stock Fund. The difference (9 basis points) may seem small, but this is just the start. I’ll explain the three issues one must consider when evaluating returns in a bit.
The key takeaway relates to the behavior of the investors in each of these funds. It is not fair to compare their performance without that context, since a small-cap value fund has a very different profile than a market index fund. It is, however, the most volatile among Morningstar’s style boxes, so it is reasonable to ask whether investors were compensated for that risk.
Read the full article here by Allan Roth, Advisor Perspectives.

