
“I saw her today at the reception
A glass of wine in her hand
I knew she was gonna meet her connection
At her feet was her footloose man
You can’t always get what you want
You can’t always get what you want
You can’t always get what you want
But if you try sometimes you might find
You get what you need
But I went down to the demonstration
To get your fair share of abuse
Singing, “We’re gonna vent our frustration
If we don’t we’re gonna blow a fifty-amp fuse”
You can’t always get what you want
You can’t always get what you want
You can’t always get what you want
But if you try sometimes well you just might find
You get what you need”
– Rolling Stones, “You Can’t Always Get What You Want“
Q3 hedge fund letters, conference, scoops etc
“You get what you need…” Did we?
It’s been a rough week for equities and few areas were spared. From the recent peak, the S&P 500 is down 15%, the NASDAQ is down 20% and foreign markets are getting hit across the board. Year-to-date through last night’s close, SPY is down 6%, EEM is down 15.7% and EFA is down 14.32%. (Source: Morningstar.) December is off to its worst start since 1930.
The phones have been ringing and the discussions intense. Minus two percent days are becoming normal. Pockets of risk are everywhere: massive debt, unfunded pension liabilities, high valuations, ultra-low bond yields, Italy, Brexit, the EU, trade issues, but perhaps none bigger than central bankers attempting to exit quantitative easing (QE). We sit on the other side of the grand experiment and the Federal Reserve in particular is looking to see if the markets can stand on their own two feet. It’s all about the Fed and there is a new sheriff in town.
I had a long conversation with John Mauldin last night. Following our call, he shared with me his letter, which he will publish this evening. John graciously allowed me to share it with you today. As usual, he simplifies the complicated and he doesn’t disappoint.
From John:
We have reached the best time of year, where we can look to the future with hope. We can stop wondering what will happen in 2018 and look forward to 2019. The investment industry always does this enthusiastically. You will see forecasts everywhere in the next few weeks.
Not wanting to be left out, or leave you wondering what I think, I usually review several other forecasts and later add my own. This year I’m turning that sequence around. Recently I did a “2019 Investment Outlook” webinar with my business partner Steve Blumenthal. So right or wrong, my thoughts are now on record. In this letter I’ll give you an abbreviated version of that webinar and add a few other thoughts at the end. In January I’ll spend a letter or two reacting to other interesting forecasts.
Powell and the New Fed
My inbox and the mainstream media have been full of criticisms of Jerome Powell’s press conference, where the market did not hear what it wanted to hear and immediately began tanking. They basically accused him of being tone deaf, not listening to what the market is telling him. The Dow dropped well over 1,000 points, over 4%, to its close on Thursday evening after Powell began his press conference. Looking at most US-based indexes, and indeed most foreign ones, we are clearly in bear market territory, with many indexes down well over 20% from their highs. What was Powell thinking?
There were many accusations that Powell fumbled the ball, not telling the market what it wanted to hear. As if that was his job.
I think it is possible that Powell said exactly what he wanted to communicate. The last three Federal Reserve Chairmen have basically acted like the Federal Reserve has three mandates: the two official ones which are keeping inflation under control and doing what is necessary to maintain full employment, and the unofficial one adopted by the last three chairmen, to make sure that asset prices rise, which is what the market wants to see happen. Not just the stock market, but real estate and all asset prices. It started with the Greenspan Put, morphed into the Bernanke Put (remember the taper tantrum?) and reached its apex with the Yellen Fed and Put.
And what did we get? A series of bubbles. Stan Druckenmiller said that the really big Federal Reserve mistake was 2003 and 2004 by Greenspan, keeping rates too low for too long, resulting in the housing bubble and the Great Recession. He clearly helped the massive bubble in 1999-2000. Obviously, Bernanke was watching the markets. His reluctance to raise rates in 2012-13 from zero when the economy was manifestly recovering fueled the asset price bubble. Yellen continued that course when she became chairman in 2014. The reluctance to raise rates until Trump won the election, when the economy was booming and unemployment was clearly falling, is inexcusable.
I think there is the very real possibility that Jerome Powell was not being tone deaf. I think there is the possibility that he wanted to communicate that the Federal Reserve is independent, not only from politicians but from Wall Street. Yes, I know he worked on Wall Street and was an investment banker, and even ran his own hedge funds, as well as numerous posts for the Treasury before he came to the Fed, so he is clearly an insider.
He is also wicked smart, maybe even wicked brilliant. He didn’t stumble or mumble at his press conference. He was quite deliberate. He knew exactly what he was saying and I’ll bet you a dollar against 27 doughnuts that he knew the market would react negatively. You cannot have his resume and not know exactly what the market would do given his quite careful press conference.
Which tells me that he is (may be? Hopefully?) perfectly willing to walk away from the third unofficial mandate of the Fed: maintaining and assisting the increase of asset prices. Is he letting his inner Volcker show just a little bit? If so, Damn Skippy and about time.
The Federal Reserve should be just as concerned about Main Street as they are about Wall Street. The serial bubbles that have been blown in the last 30 years have had serious negative consequences when they all blew up. I mean, the ride was often fun, and a lot of us made good money in both the up and down cycles. But Main Street would be better served with a steady as she goes policy at the Federal Reserve.
Wall Street (and all of us in the financial world in general) should go back to creating earnings and valuing companies based on those earnings, and not gaming the system because of interest rate differentials and hoping for stock market P/E increases, to the point where valuations get incredibly stretched and then the bubble pops. Which is simply killing the average investor who bought passive investment index funds, probably later in the cycle, and who are now being seriously damaged. And will take a little bit more pain before they get out of the market at exactly the wrong time. Investing is seen as a game to be played by Wall Street, and many of them do quite well, but investing to Main Street is about retirement and life. It is anything but a game.
How will we know if Jay Powell is serious about his inner Volcker? In Texas, we would say we will know if he doesn’t crawdad on us. For those outside of Texas and the South, that takes a little explaining. I grew up in West Texas where farmers and ranchers would create “tanks” or ponds. These would basically be watering holes for cattle built to catch and hold rainwater. For whatever reason, don’t ask me where they came from, crawdads (crayfish in more polite circles which look like tiny little lobsters) would gather around these tanks, burrow holes into the ground around them, and live happy little crawdad lives. Until some young kid would come along, throw a piece of small bacon with a string attached to it in front of their home, then when they would come out and grab the bacon, jerk the string, quickly pick up the crawdad, put them in a bucket and sell them to strange adults who would pay you a nickel apiece. Just for a silly crawdad. Later in life I learned that crawfish etouffee is a serious meal in Louisiana and much of Texas. Next time you go to Pappadeaux’s, order the crawfish etouffee. It is not cholesterol friendly, but it is really good.
But, back to the main plot: when those crawdads sense danger, they start walking backwards to hide in their hole. Hence the term, “Are you crawdadding on me?” Meaning are you backing away from what you said or want back what you gave me? It was generally not said in a polite manner. If you crawdad on someone, you broke your word. You can watch a quick video on YouTube of a crawdad walking backwards here.
If Powell lets the markets do what they want to do, without coming back and giving a speech essentially saying “I’m sorry, I really meant to be more dovish,” then we will know he is really trying to establish the independence of the Fed and has decided to go back to the two main established mandates. Which if he does, I will stand up and applaud. Loudly and with enthusiasm. Will it cause me personal pain? Sure. I’m trying to sell my home now, and what he did is not going to help real estate values. (By the way, if you are reading this and thinking about buying my home, don’t lowball me. I’m not paying attention to Powell and the Fed either. Value is value.)
That being said, if he really sticks to his guns (mixing metaphors here), then the United States and even the world will be better in the long run. And let’s hope his successors at the Fed do the same thing. After a president appoints them, simply and politely take the president’s call, ignore the tweets, and set your own independent course.
Will there be a time to cut rates? Absolutely. And I fully expect him to do it when the data, when the economy, tells him it is time to do so. When unemployment starts to rise or deflation rears its head. But not because of some tantrum in the %#$%% markets. That is not the Fed’s mandate.
Here’s hoping for a world where the Fed chair is not the second most important person in the world. Where most of the people don’t even know his or her name. Where we don’t live and die by some stupid dot plot, but on whether the companies we have invested in actually increase their earnings and do what they say they want to do. I can dream, but I’m not the only one…
And now, let’s look at an abbreviated version of my recent webinar.
Late in the Cycle
As a preface, I think I have a pretty good record calling major economic and market turns. My weakness is timing. I tend to be early and, as I mentioned last week, miss some opportunities near the top. My solution is to separate my own outlook from my portfolio decisions. Using multiple, systematic trading systems seems to work better, which is why I’m in business with Steve.
However, the annual forecasting exercise still helps. For one, it forces me to review the data and identify the key issues that will affect my investments. Then, as the year unfolds, I can watch what actually happens and compare it with what the machines are doing to my money. When they’re not in sync, I can more intelligently evaluate why. This gives me more confidence in the systems and helps me stick with them through the inevitable bumps. The end result is better investment results over the long run. So this isn’t just academic thought or entertainment. It matters to your and my money.
What follows is a mix of my own thoughts as well as Steve Blumenthal’s. We’ll look at three topics: recession probability, credit conditions and stock valuations. We went deeper on the webinar. You can read a transcript or view a recording of the full webinar here, which is about three times as long with a lot more charts.
I began reading John’s weekly letter sometime in 2000 or early 2001 and it has hit my email inbox every week since. He’s an exceptional economist, deep thinker and writer. I like how he has the conviction to share his forward view. It’s hard to be bullish when everyone is bearish, like in mid-2002. And it’s hard to be bearish when everyone is bullish, like late 1998-99 when the yield curve inverted. Writing about the sub-prime crisis, the housing bubble, the derivative mess and the likely crisis ahead 2006-2007 fell on deaf ears. After all, the economy was booming with employment low and the housing market on fire. The economy was good at the peak of the great tech bubble in 1999 as well. All’s good when liquidity is available… until it isn’t. I got a nice email last week from an advisor client who said, “Please tell John he saved me and my family in 2008.” So I look forward to John’s Thoughts From the Frontline email every week and hope you do as well. If you’d like, you can sign up for John’s weekly free e-letter here.
My Susan and I wake early. She makes the coffee, puts soft music on and we sit quietly in our favorite chairs. With coffee in hand, the first thing I do every Saturday morning is read John’s letter. Other pieces of research that I wasn’t able to get to during the week are stashed away for a bit, because John’s letter comes first. I read and learn. And you’ll find he’s a great story teller, as you can see above (crawdadding!)… Come on, who stories like that? When you meet him you’ll find he is as down to earth and likable as you’d imagine. John’s letter continues immediately below… Simply click on the orange On My Radar button below and scroll down to the “Late in the Cycle” section. I hope you find this week’s post helpful.
♦ If you are not signed up to receive my weekly On My Radar e-newsletter, you can subscribe here. ♦
Follow me on Twitter @SBlumenthalCMG
Included in this week’s On My Radar:
- Late in the Cycle by John Mauldin
- Tweets of the Week
- Trade Signals – More Weakness, Volume Supply Sell, Watch HY, Equity Trend and EXTREME PESSIMISM
- Personal Note – Merry Christmas
Late in the Cycle by John Mauldin
As a preface, I think I have a pretty good record calling major economic and market turns. My weakness is timing. I tend to be early and, as I mentioned last week, miss some opportunities near the top. My solution is to separate my own outlook from my portfolio decisions. Using multiple, systematic trading systems seems to work better, which is why I’m in business with Steve.
However, the annual forecasting exercise still helps. For one, it forces me to review the data and identify the key issues that will affect my investments. Then, as the year unfolds, I can watch what actually happens and compare it with what the machines are doing to my money. When they’re not in sync, I can more intelligently evaluate why. This gives me more confidence in the systems and helps me stick with them through the inevitable bumps. The end result is better investment results over the long run. So this isn’t just academic thought or entertainment. It matters to your and my money.
What follows is a mix of my own thoughts as well as Steve Blumenthal’s. We’ll look at three topics: recession probability, credit conditions and stock valuations. We went deeper on the webinar. You can read a transcript or view a recording of the full webinar here, which is about three times as long with a lot more charts.
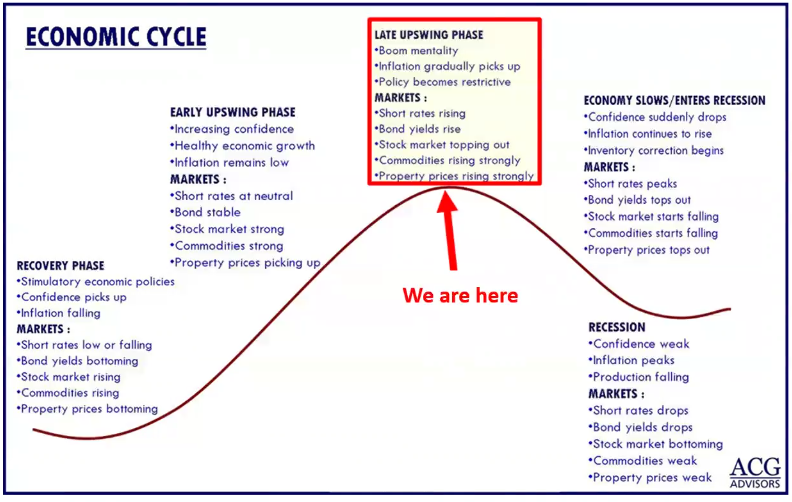
Source: CMG Capital Management Group; ACG Advisors
Steve started our webinar by noting we currently sit late in an economic cycle. He showed the chart above to illustrate how all cycles have expansion periods and end with recession. The longest expansion cycle (1991-2001) lasted 10 years or 120 months. The average since 1854 is 40 months and then recession, then expansion, then recession.
The 2001 post-recession recovery lasted 80 months – ending, of course, with the Great Recession. We are 114 months into the current expansion, the second-longest in US history. Again, a recession is coming. The question is when. This expansion will break the record if it persists through 2019.
If we don’t get lucky and recession strikes next year, then what? Aside from the layoffs and business problems, the stock market declines on average about 37% in recessions. The last two saw 50% drops. If you think your buy-and-hold portfolio can ride that out, everything we know about behavioral finance says you are probably wrong.
Steve watches an indicator from Ned Davis Research called the Global Recession Probability Model. I want to thank them for being able to use this.
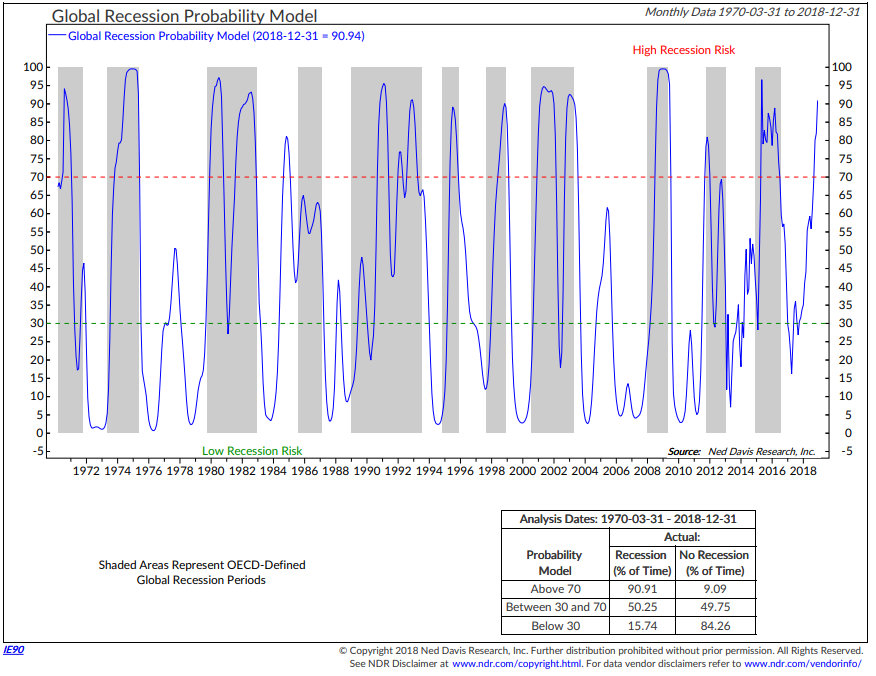
Source: Ned Davis Research
This model measures leading indicators across 35 countries, things like money supply, yield curve, building permits, consumer and business sentiment, share prices and manufacturing production. It’s done a good job at calling recessions, shown in the gray bars. Any reading above that red dotted line of 70 is the danger zone. When that’s occurred, over 90% of the time we’ve been in recession.
On the webinar, I pointed out that on this very useful chart, the indicator doesn’t just indicate a coming global recession. It says we’re in one. Economists identify them in hindsight. We only know we’re in a recession when we look back over the past data. So the gray bars don’t appear in real time. They get added later.
There was a quarter in 2000 that we were in a recession for just one quarter. It was three years later they tell us this. Now, it didn’t change anybody’s trading when they announced it and few noticed because it was three-year-old news. But it illustrates that economists are pretty bad at actually recognizing recessions in real time. We could find out in late 2019 that a recession began sometime in the spring of 2019.
However, this next NDR index is global, and we know the US economy is doing better than most. This next chart is US-specific and shows the year-to-year rate of change in the Employment Trends index. Note how when employment trends have declined, recession followed. The grey bars show the periods of recession. So when the labor markets are weakening and below the zero line, recession is a risk. Conditions are currently favorable, with low recession risk.
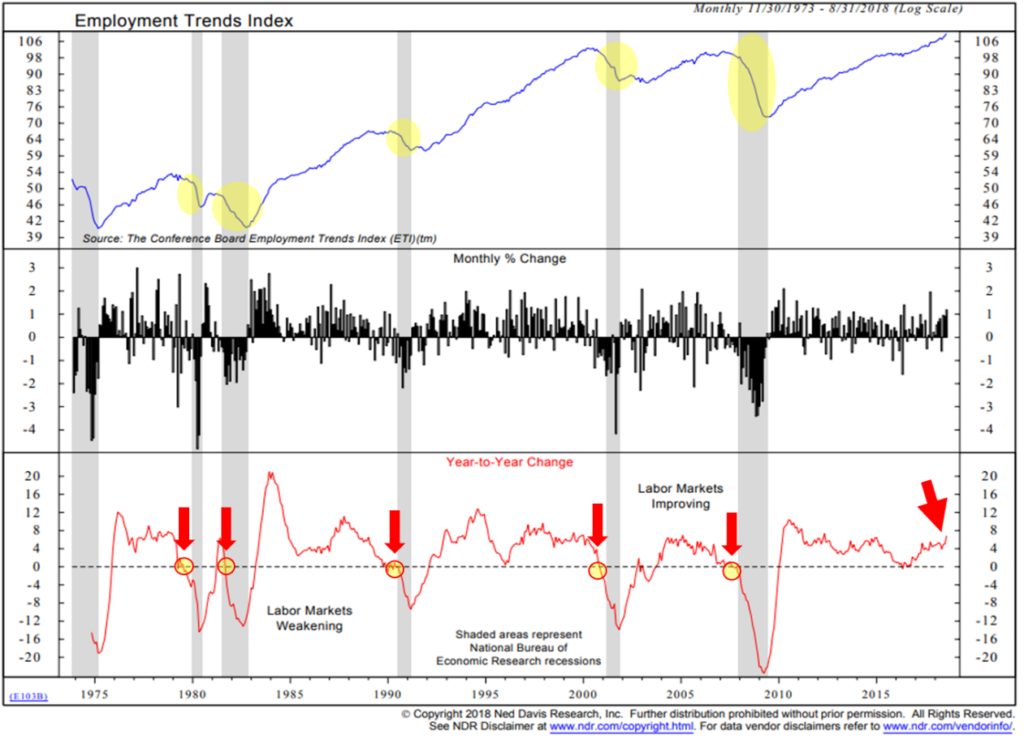
Source: Ned Davis Research
Next, let’s look at the yield curve. I explained last week that it’s flattening but not yet inverted, which would signal recession 9-15 months later. Ned Davis looks at the difference between the six-month Treasury bill and the 10-year Treasury note. The chart shows when that short-term yields were higher than the longer-term one, i.e. an inversion. We’ve highlighted those periods in yellow circles. Typically, it’s anywhere from 9 to 15 months between the inversion and the beginning of a recession. Presently we are not there yet. Yet being the operative word.
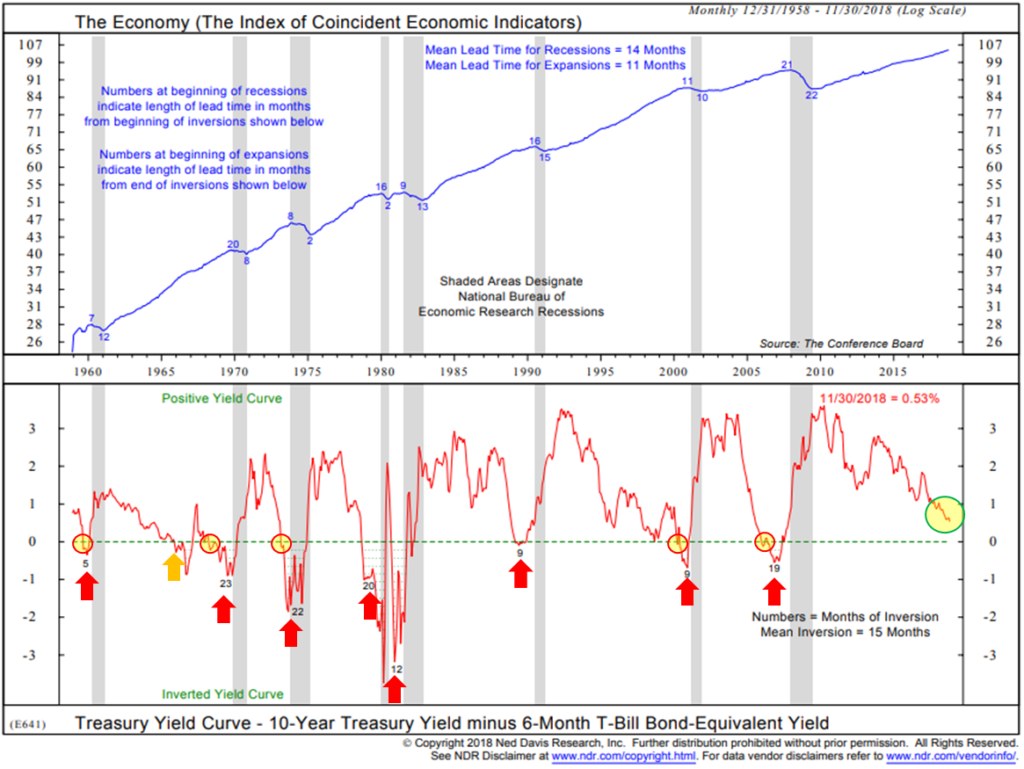
Source: Ned Davis Research
As you’ll notice in the chart, the yield curve nearly always turns positive before we actually go into recession. I know this from painful experience. As I related last week, I called the last recession after the yield curve inverted and the markets promptly went up 20% more.
As of now, portions of the yield curve are flattening. It looks like the beginning of an inversion. The Fed seems aware of this as learned at their meeting this week.
Bond Boom
Unfortunately, recession isn’t the only risk we face for 2019. I’ve talked several times this year about corporate debt and it just keeps growing. The corporate bond market is roughly three times bigger than it was at the time of the 2008 crisis. Worse, its quality is dropping as its quantity increases. In 2008 the US had about $3 trillion in corporate bonds outstanding. Now we have far more than that just in the BBB ratings or below.
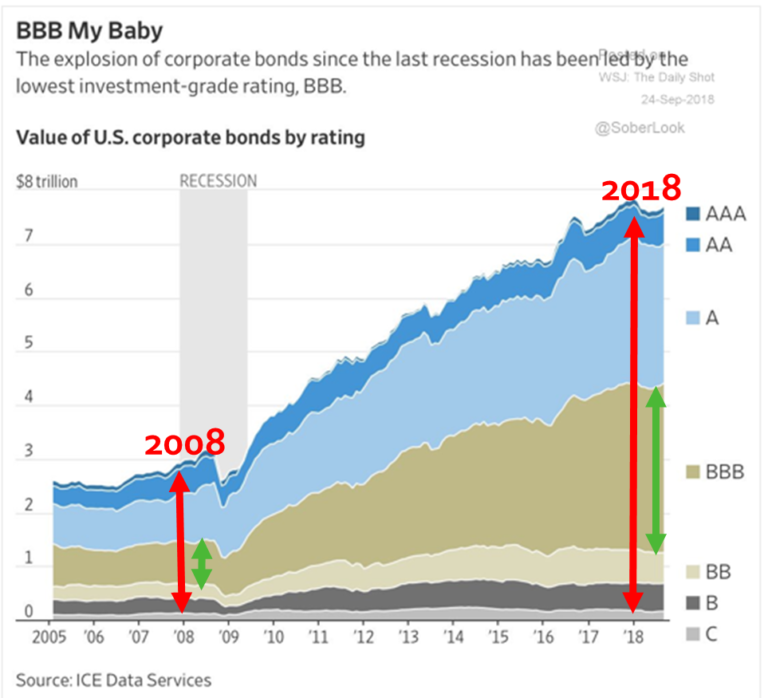
Source: CMG Capital Management Group; ICE Data Services
This might be tolerable if corporations were, as a group, highly capitalized with fortress-like balance sheets. Some are but a dangerously high number are not. Yield-hungry investors have been throwing money at companies, which naturally accept it and don’t necessarily make good use of it. Some large companies are living on borrowed money and don’t have the reserves to survive long without it.
Having said that, such problems are not widespread yet and won’t necessarily become so in 2019. Here is another Ned Davis chart. Look at the lower portion, which is their Credit Conditions Index.
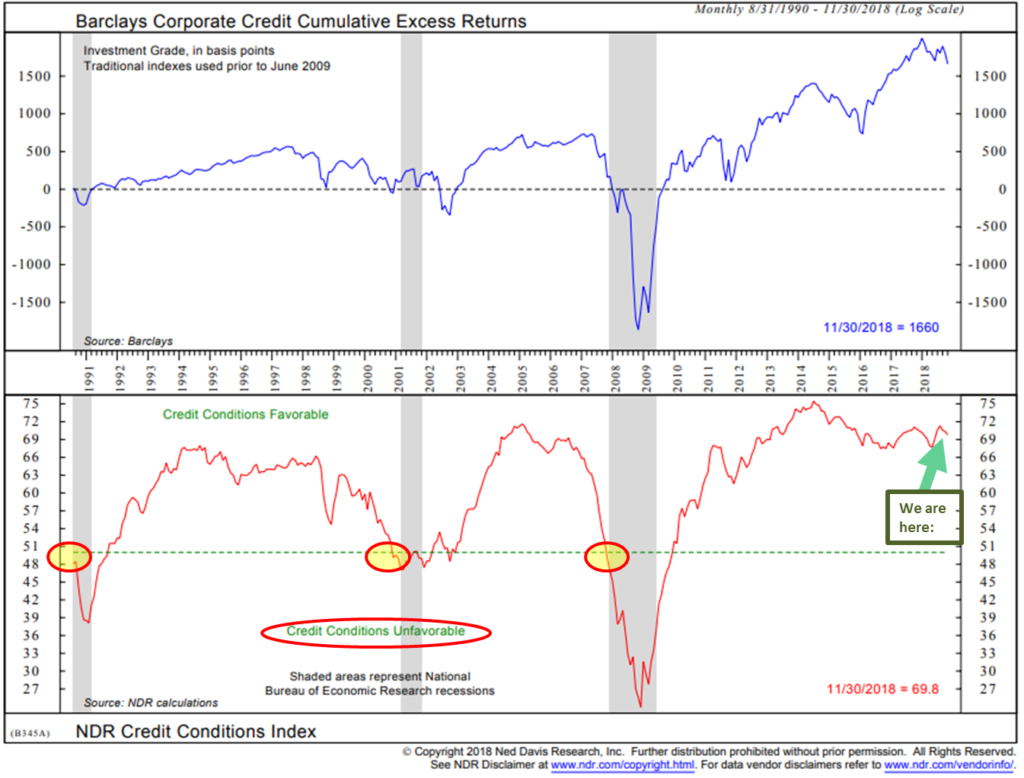
Source: Ned Davis Research
A dip below the green dotted line signals the kind of unfavorable credit conditions that would mean trouble for leveraged companies. As Warren Buffett famously puts it, that’s when the tide goes out and you see who’s swimming naked. The last three times happened near the beginning of recessions. Presently we are far from that point.
On the other hand, notice how fast the index fell just ahead of the last recession. It could change considerably by this time next year. That might happen if the Fed tightens too much, or federal deficits ‘crowd out” capital from the corporate markets, or some other stressful event occurs. So while this looks okay for now, it is important to watch, which Steve does.
Priced to Sell
Finally, let’s get to what is most important for investors. Are your stocks safe? The quick answer is stocks are never safe. If safety is the priority you should probably consider something else. Stocks are a “risk” asset. The real question is whether the gains adequately compensate you for the risk you are taking. The higher the valuation, the less you are being paid. That makes this next chart disturbing if you’re long stocks.
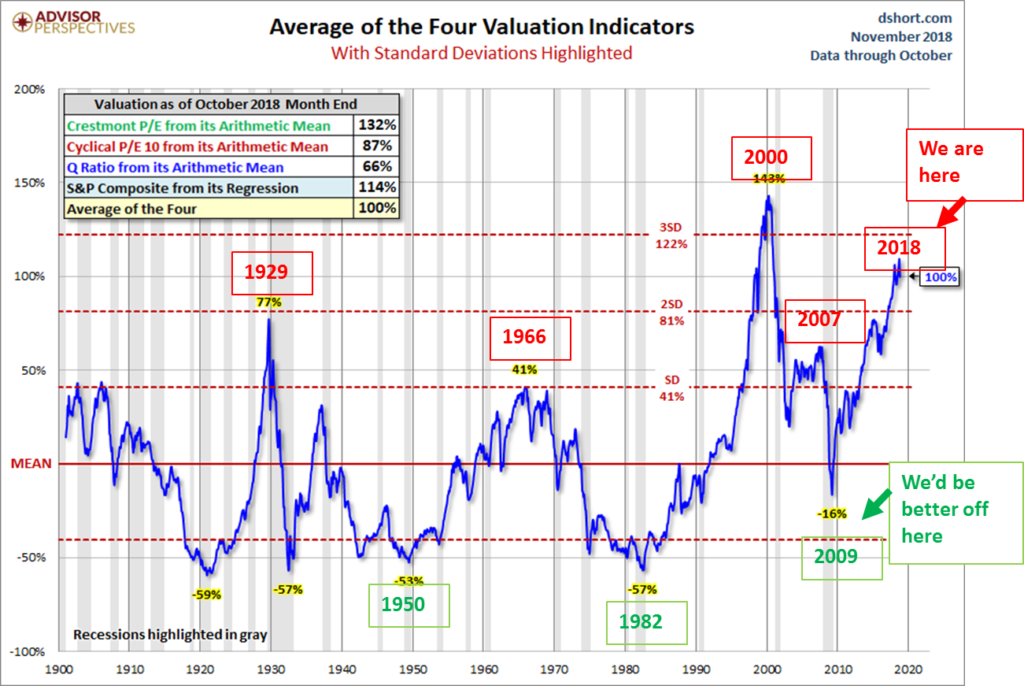
Source: Advisor Perspectives
We see here four popular valuation measures, the average of which crunch to the second-highest stock valuations since 1900. That was in 2000. We are much higher than in 2007, which led to a 55% peak-to-trough decline.
That kind of decline won’t necessarily happen next year, but is all but certain within ten years. So this may not be a “sell” signal but it sure looks like a “Don’t buy” signal. And even with the recent and significant drop in the stock market, I would not bring up “buy the dip” mentality to my investment selection today. Note the bottom section of the chart where it says, “We’d be better off here.” That’s what a buying opportunity looks like. Buying opportunities happen at the bottom of the markets when everybody is scared. That’s the case for stocks, high yields, real estate and everything else.
When people tell me they’re worried about having too much cash, I like to remind them cash is an option on the future. It’s not earning very much right now, but could potentially earn a whole lot when you buy at the bottom. I’m not looking at this and panicking at all. I’m rubbing my hands at the chance that’s coming to buy solid assets on the cheap.
[SB here: And this conclusion to John’s letter is just too good not to share with you.]
Have Yourself a Merry Little Christmas
It’s time to hit the send button. I will follow up this letter next week with my final year-end thoughts as we look to a brand-new 2019. Between now and then, my very best to you and your families and friends, and here’s wishing you the best of the holiday season. The best gift I get from anyone is from you and the time you graciously give me reading my Thoughts from the Frontline. Thank you so very, very much.
Let me give you a small gift that may help lift your spirit as well. My favorite version of the famous Christmas song, “Have Yourself a Merry Little Christmas,” was done by Frank Sinatra, who as Judy Garland did before him, asked the original songwriter to change the lyrics to make them more upbeat. Judy Garland used Sinatra’s version of the lyrics later when she did her TV special. You can listen to the Chairman of the Board himself sing that song here.
And for some nostalgia buffs, look at the personalities in the audience. And if you really like nostalgia, go to the one 1:54 mark in this 1957 YouTube video and listen to Bing Crosby, later joined by Sinatra singing to their friends “I’m Dreaming of a White Christmas” like nobody else has ever done. It really will make your heart a little lighter.
Faithful friends who have been dear to us will be near to us once more….
Your dreaming of a new Fed policy analyst,
John Mauldin
You can sign up for John’s free weekly e-letter here.
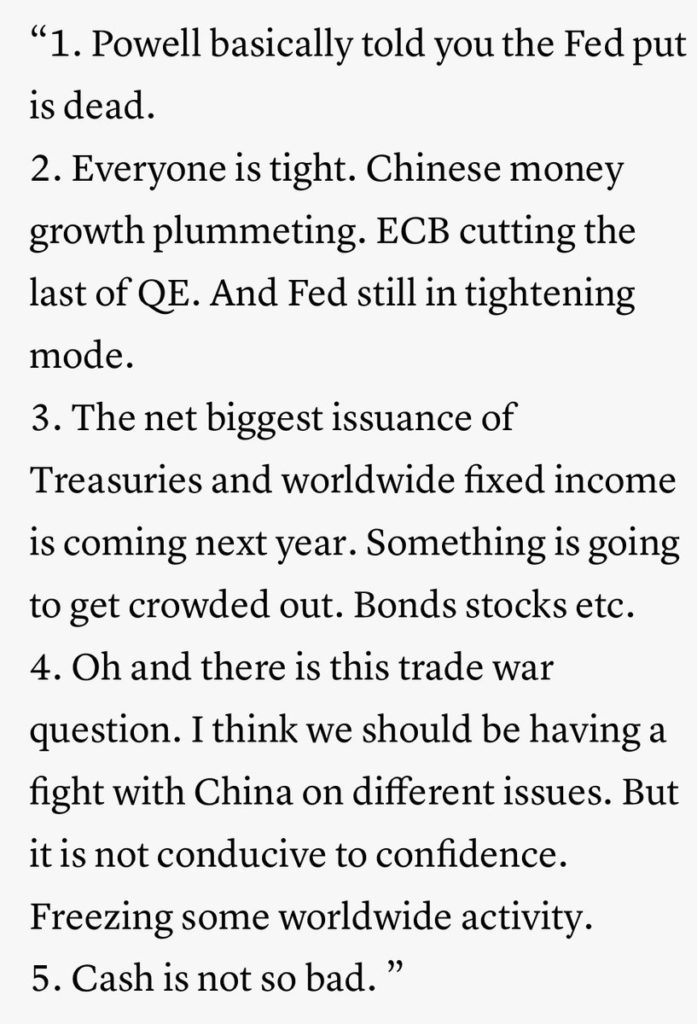
Hedge Fund billionaire David Tepper on CNBC – September 2010 and December 2018:
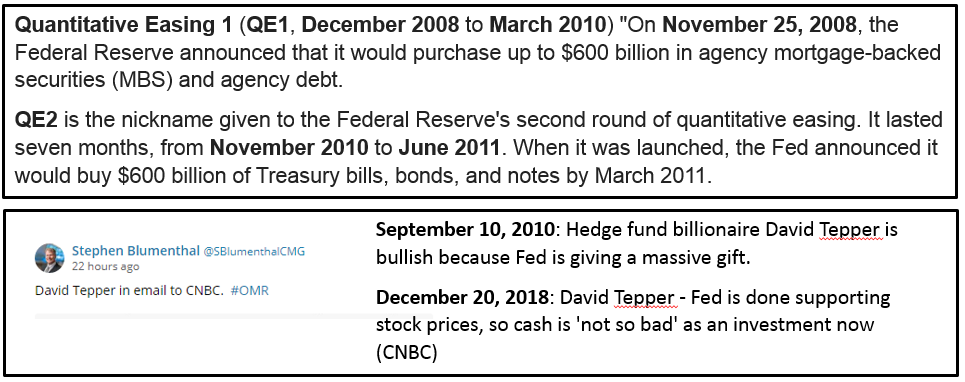
More from Tepper:
I share some of my investment thinking in the Trade Signals section below. I expect a year-end rally, a continued topping process and recommend a risk management game plan.
Trade Signals – More Weakness, Volume Supply Sell, Watch HY, Equity Trend and EXTREME PESSIMISM
December 19, 2018
S&P 500 Index — 2,506
There are a rare few times in the last 12 years when the Daily Investor Sentiment reading has been this low (chart below). It currently stands at 15.56. To put this into perspective, it bottomed at 16 in early March 2009 just after the market made its low at 666 on March 6. The lowest reading was 10 made in late 2011. There have been just five times since 1995 that reading was below 10. Extreme pessimism such as this is short-term bullish for equities. I expect a Santa Claus rally.
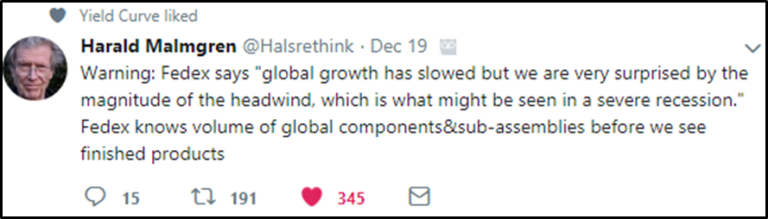
In the bigger picture, the market is signaling economic slowdown. The plunge in FedEx stock (NYSE: FDX) and the transportation index is a warning of global economic weakness. FDX is down from $270 per share in January 2018 to $163 today. And it’s down 12% just today at the time of this writing. The famous Dow Theory signal, when both the DJIA and the DJ Transportation Index are below their 200-day moving average lines is also in a sell. Also notable this week is the Volume Supply vs. Volume Demand, a measure of buying and selling pressure, moved to a sell.
This from John Murphy at StockCharts.com early today:
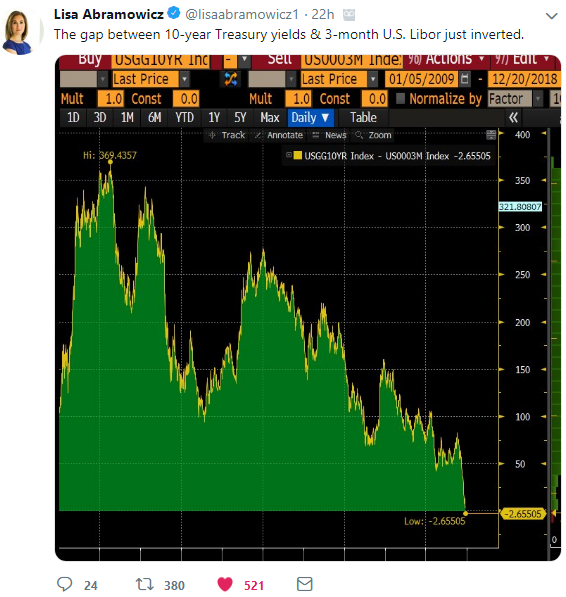
TODAY IS A BIG DAY FOR THE FED — AND FOR THE MARKETS … Today is one of the most important Fed days in recent memory. That’s because there’s a lot riding on what it does this afternoon; or doesn’t do. It’s widely expected to raise rates today and then sound more dovish for next year. That might be enough. Other voices are calling for the Fed to keep rates unchanged. The problem there is that a sudden change of plans by the Fed would be an admission that economic conditions are starting to deteriorate. Stocks might not like that. There are other factors favoring a more dovish Fed. One is the yield curve falling to the lowest level in a decade (see yield curve chart in the recession watch section below). The falling 10 year – 2 year yield spread is dangerously close to inverting. With bond yields falling, additional rate hikes could push short-term yields above longer yields which could cause the yield curve to invert. That’s usually an early sign that the economy is heading toward a recession. Does the Fed really want to risk doing that?
Chairman Powell totally botched the post meeting conference. Camp Kotok fishing buddy Sam Rines put it this way in a note to me this afternoon,
Instead, Chair Powell was all over the place with an incoherent statement surrounding the balance sheet and further oddities about inflation and rate hikes. Further, he commented on financial conditions and how those could eventually affect the real economy. In reality, the balance sheet is already distorting some short-term funding markets, inflation is exceedingly tame (and likely to stay so), and tighter financial conditions are already biting… In the end, there is a significant likelihood that this meeting will be the one remembered as “the one”. The one where the Fed had avoided a policy mistake until the Chair lost the market’s trust through an incoherent rambling press conference.
The market was up over 1% earlier today and just prior to the Fed announcement it was flat. After the announcement the market turned south and finished the day down 1.50% and closing below the lows made early in the year. Who said exiting QE would be easy. The pattern of lower lows and lower highs remain in place. We are in a cyclical bear market.
Several clients emailed me this week with appropriate concern. Many readers follow the Ned Davis Research CMG U.S. Large Cap Long/Flat (“Long/Flat”) signal and many are invested in the strategy with us or via the ETF that is available through VanEck. Following is my reply:
Please know I did receive your email and want to make sure I share with you my thinking as it relates to Long/Flat and the market trend in general. To begin, I use Long/Flat for both our clients’ large-cap and mid-cap exposure. I also use it for some of my personal 401k allocation work. I use another moving average trend signal for an adviser client who has a dividend ETF. It is somewhat similar to the 200-day MA entry and exit and re-entry rule. Overall, I like a few different rules based exit and entry processes since none are perfect but most are very good. It also diversifies my risk management, which I believe is beneficial in the long run. If I put 100% in one process and its right 75% of the time, that means I’m wrong 25% of the time and loved 75% of the time. And 75% is a good win rate. It’s hard to be 100% wrong 25% of the time when working with a client. I want to repeat, none are perfect but all of the processes I share in Trade Signals are good. It’s about avoiding the really big mistakes and intermediate trend-based risk management and reentry rules can help you avoid the big declines. My favorite is Long/Flat but of course I’m biased in many ways. I have relied on NDR’s Big Mo since the 1990’s and with good success. Long/Flat is similar and I personally like it over Big Mo, but don’t tell Ned at NDR. He’s one of my heroes. What’s most important is that I trust it and have the conviction to stick to it. That’s something important for whatever process you get behind as well.
BTW, Big Mo too remains in a buy signal as do both the S&P 500 200-day MA rule and the NASDAQ 200-day rule. All of the trend processes I follow are trending down. The average cyclical bear market decline, absent recession, is 23%. NDR’s Big Mo is -19% and I can tell you I lived through that experience watching Big Mo every day. So the current drawdown is something I expect to happen.
The really bad declines happen during recession. Equities lead recession (a good pre-recession indicator) and absent recession a bear is -23%. We are -13.5% from the January high. Bottom line: While I write about risks in On My Radar all the time and see the current set of risks (late cycle, high debt, high valuations and low yields) material, the trend signals remain weakening but still in a buy. I just don’t see recession in the next six to nine months, so we are likely in a non-recession cyclical bear market and not the big recession bear I see coming in the next few years… Mauldin’s “Great Reset.”
Long/Flat is declining so lights are on… but still an 80% signal… The model line needs to drop 5 points to move to 40% exposure. The overall trend for the market is down and our model line is trending down. Markets tend to top and roll over. They don’t tend to top and spike lower (unless really bad event news). Markets “V” off of a bottom. Long/Flat looks at the ST, MT and LT trend of 24 sectors, scores up the trend and then smooths the trend with a 63-day smoothed MA line. What you see in our charts is the smoothing of the score. Currently around 65, down from 70. A drop below 60 takes us to 40% exposure and a drop below 50 takes us to 0%. But re-entries are different and happen more quickly. This is because of the “V” nature market bottoms (think margin calls, forced selling, panic selling and would be buyers step aside… until selling is flushed out).
Hope this helps! Please email me if you have any questions.
As the great Art Cashin says, “Stay wary, alert and very, very nimble.”
Click here for this week’s Trade Signals.
Important note: Not a recommendation for you to buy or sell any security. For information purposes only. Please talk with your advisor about needs, goals, time horizon and risk tolerances.
Personal Note – Merry Christmas
We are soccer nuts in our family and love watching the Premier League. Knowing it’s a Friday writing day, Susan shared an important message with me this morning. Much in sport mirrors life. Pep Guardiola is the manager of Man City and his team averages 731 passes per game in Premier League. To my British friends, yes, I’ve abandoned Man United. Call it manager Jose Mourinho fatigue, though I did notice he was sacked this week. So I may be back. But for now, it is Man City and Liverpool. I just love their styles of play. Pep’s Man City controls the tempo in every game. Their style of soccer is aggressive and exciting to watch as they attack the goal. Pep has had success everywhere he’s been, and Man City currently sits second in the table and one point below undefeated Liverpool. Anyway, Susan is always thinking about my firm and is my best business counsel. The quote she shared with me follows. I believe it is appropriate for business and for investors.
An interviewer asking Pep if his aggressive offensive approach leaves his team vulnerable: “Does that mean you risk counter attacks?”
Guardiola: “Yes…. but I think it’s more risk when you don’t risk.”
It’s more risk when you don’t risk. But he doesn’t get aggressive blindly. When Man City loses the ball, they immediately swarm the player who stole the ball. You just don’t see other teams do that. Meaning the players train purposely to quickly defend. It’s a risk mitigation game plan and only effective if the team acts quickly and aggressively together. Most teams settle back, Man City players are coached to pounce. The physical conditioning and practice that requires is intense.
Same with investing. Create a game plan in place that works for you and stick to the plan. You’re going to give up some goals and experience a few losses. But you need to take risk, and it’s good to have a solid defensive plan in place that enables you to avoid the really big mistakes. My best two cents…
Thank you for reading On My Radar. Please know how much I appreciate the time you spend with me each week.
Our daughter, Brianna, came home last night, Matthew flies home tomorrow and our four boys are home and finding the food far better than dorm food. Grandma Pat is here and a big Christmas dinner is planned. I do so love when everyone is home and I’m really looking forward to some down time. I hope you are too.
Best to you and your family. Wishing you a warm and joy filled holiday. Merry Christmas!
♦ If you are not signed up to receive my weekly On My Radar e-newsletter, you can subscribe here. ♦
I’m checking in happy and hope you are feeling happy too.
Merry Christmas and happy holidays,
Steve
Stephen B. Blumenthal
Executive Chairman & CIO

