
What have I learned so far?
Q1 hedge fund letters, conference, scoops etc
SUMMARY
- There is consistency in the performance of the Value factor across markets and asset classes
- Allows to create a coherent framework of how to think about Value
- Suggests a global driver of factor performance
INTRODUCTION
Our research aims to educate investors by bridging the gap between academic literature and practical investing. In contrast to our usual research notes, this one is more personal as I will document some of the key insights I have learned about the Value factor in recent years. The objective is to outline my current framework and update this as my education continues.
Naturally there are many academics and investors who have done far more work on the Value factor for far longer. In fact, most of our efforts are based on the research of others, which we analyze and then either challenge or aim to enhance by providing a new perspective. It is tough to innovate in quantitative research and I am not certain that we as a firm have found something truly unique yet, but we keep on searching.
However, there are also many conflicting views, which is one of the reasons why investing is so challenging. I believe it helps to occasionally step back and aggregate what I have learned into a coherent, data-driven framework.
This research note summarizes some of the basic characteristics of the Value factor performance.
HOW SHOULD VALUE BE MEASURED?
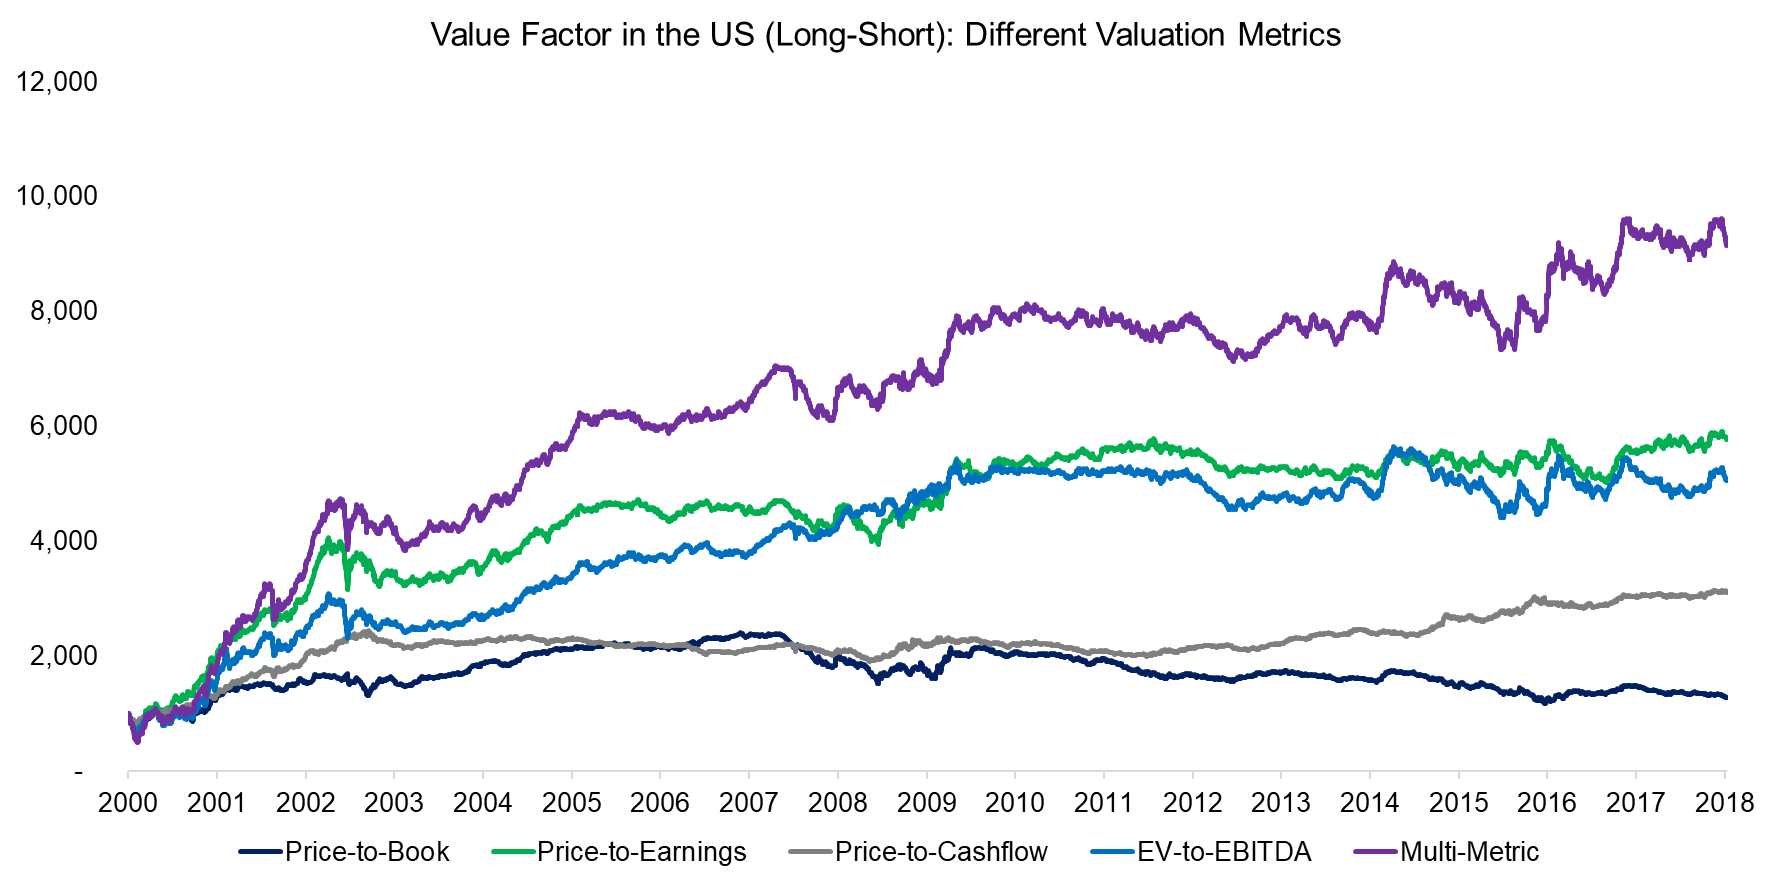
The Value factor is defined as buying cheap and selling expensive stocks. Academic researchers like Fama and French tend to use price-to-book multiples as valuation metric while practitioners prefer price-to-earnings, price-to-cashflow, or EV-to-EBITDA. Price-to-book is perhaps less accurate for valuing a company due to accounting reasons like stale book values, but investors should note that billions have been allocated to investment products using the metric given its important status in academic research.
In order to compare the different valuation metrics, we create beta-neutral long-short Value factor portfolios in the US stock market. The analysis highlights that the returns of the portfolios were heterogeneous since 2000, although they share common trends. For example, all portfolios generated strong performance after the Tech bubble imploded in 2000 and were more or less flat since the global financial crisis in 2008.
Investors questioning whether there is an optimal metric for measuring cheap and expensive stocks should consider using a multi-metric approach as that tends to lead to the most robust results for harvesting returns from the Value factor.
Further research: Value Factor: Comparing Valuation Metrics
Source: FactorResearch
WHAT IS IN MY VALUE PORTFOLIO?
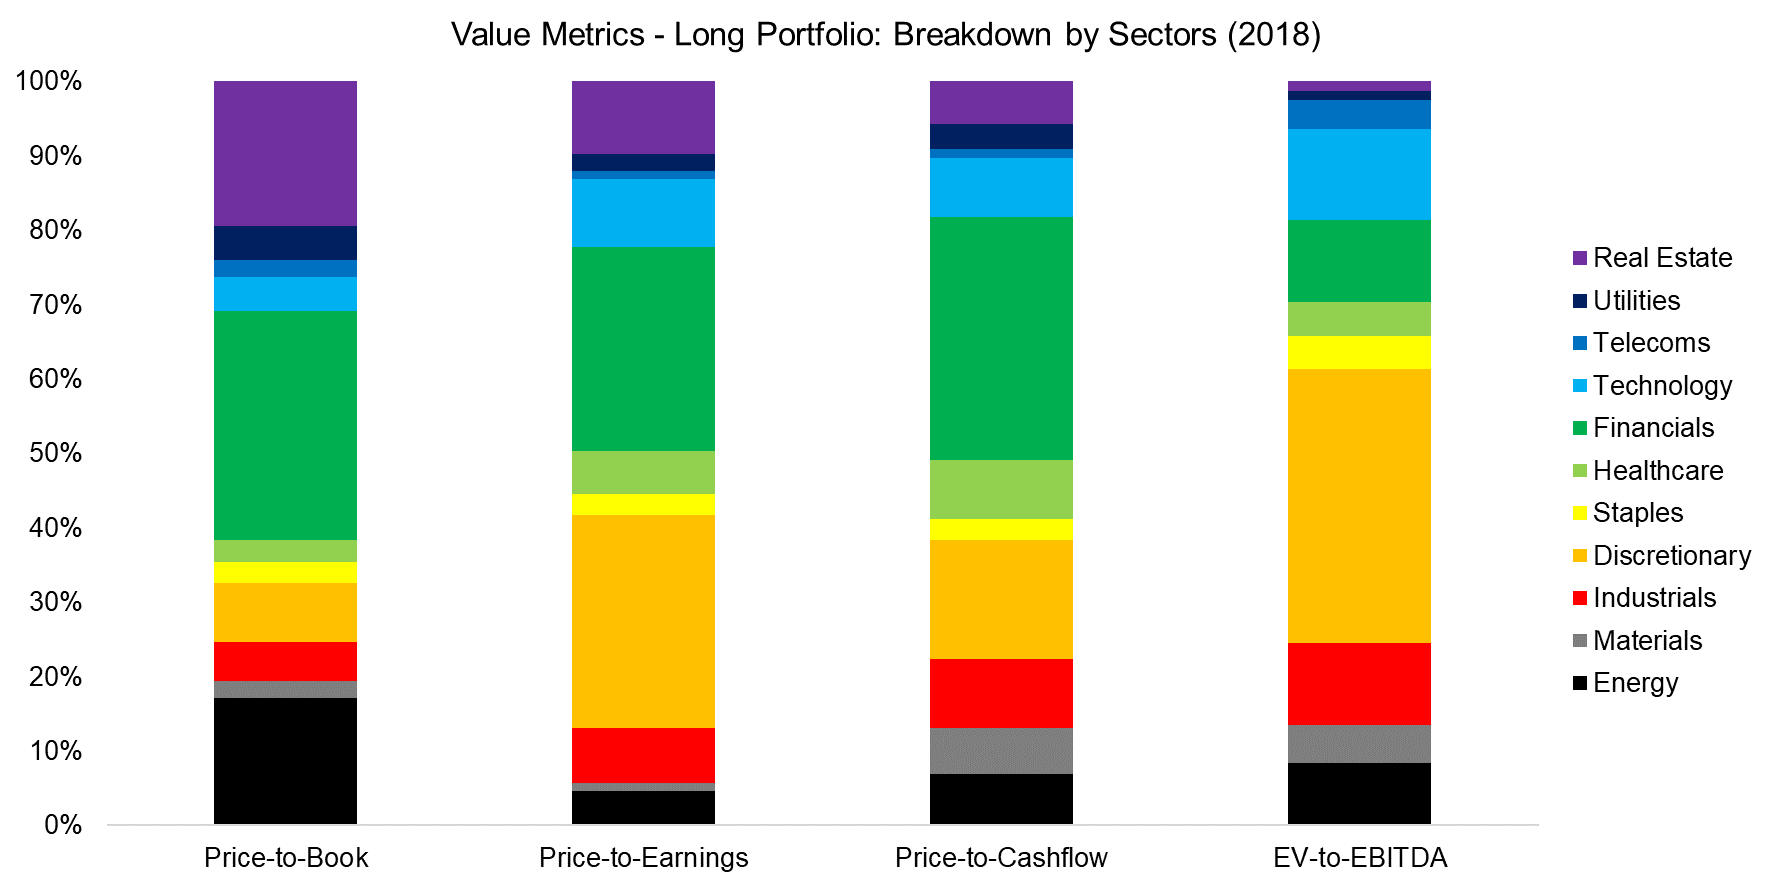
We observe that the long portfolio of the Value factor, i.e. cheap stocks, is dominated by financial and consumer discretionary stocks, although it does depend on which valuation metrics is used. The short portfolio features similar sector biases and is mainly comprised of technology and healthcare stocks. These over- and underweights have not changed significantly in the last two decades and are partially structural.
Further research: Value Factor: Comparing Valuation Metrics & What’s In a Factor? Breakdown by Sectors
Source: FactorResearch
Cross-sector Versus Sector-neutral Value Factor Performance
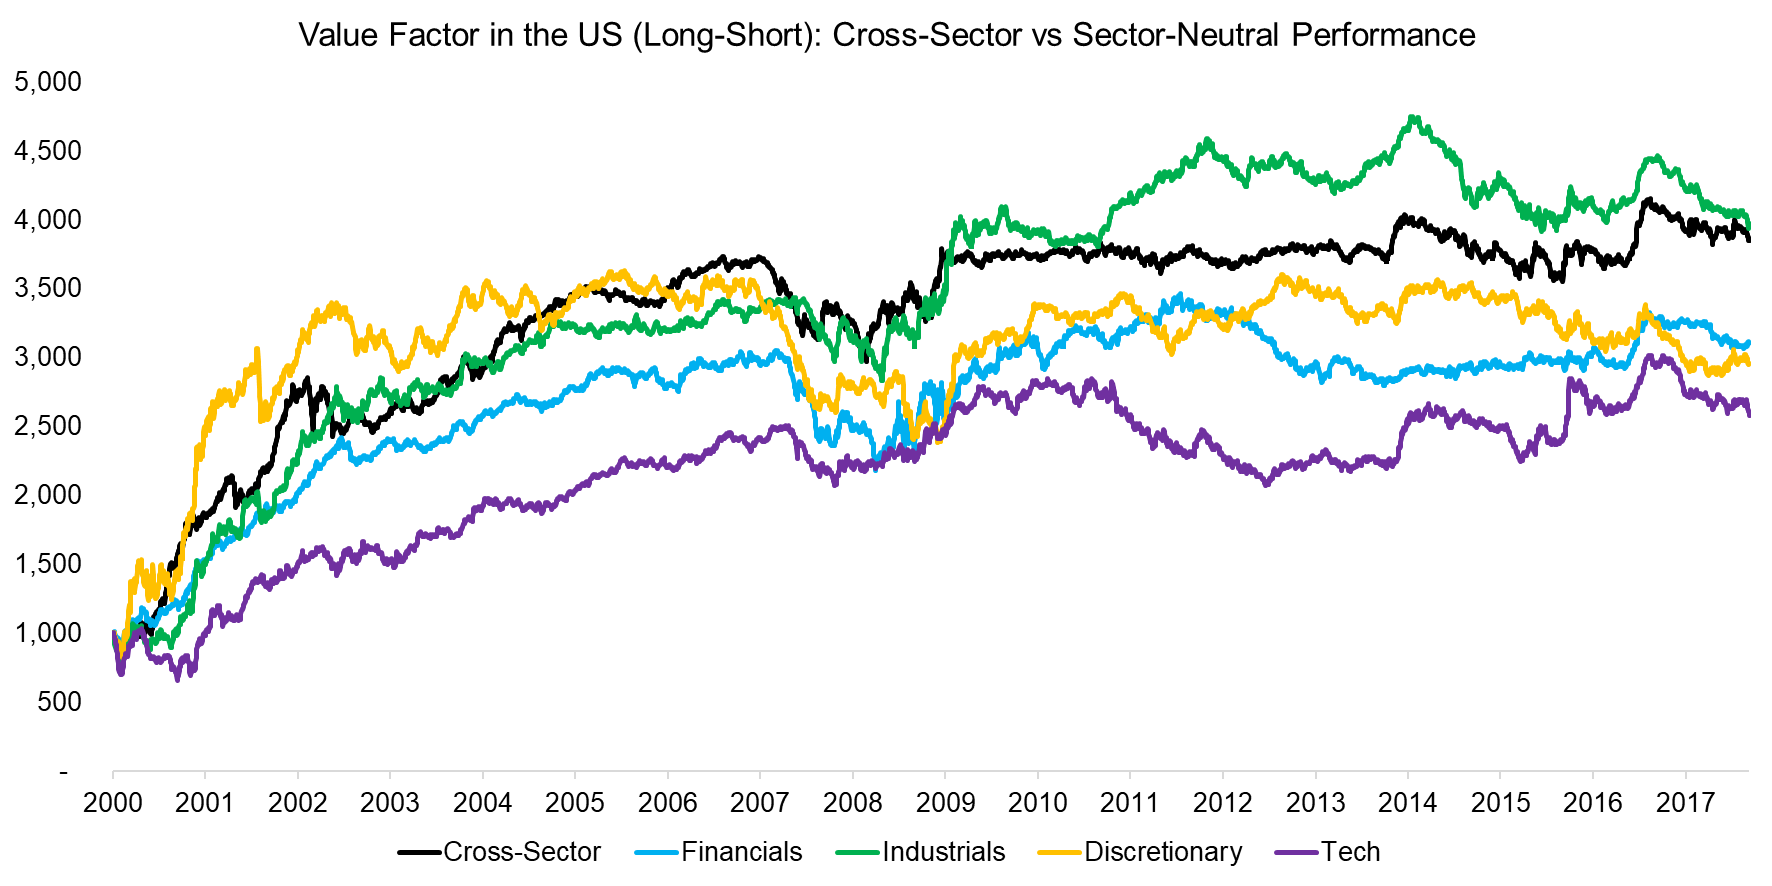
Investors aiming to harvest returns from the Value factor might consider structuring the portfolio sector-neutral to minimize any sector bias. However, if we compare the performance of cross-sector versus selected sector-neutral portfolios, we observe almost identical trends. It seems that sector biases do not explain the performance of the Value factor.
Related research: Value Factor – Intra vs Cross-Sector
Source: FactorResearch
Value Factor Performance Across Market Capitalizations
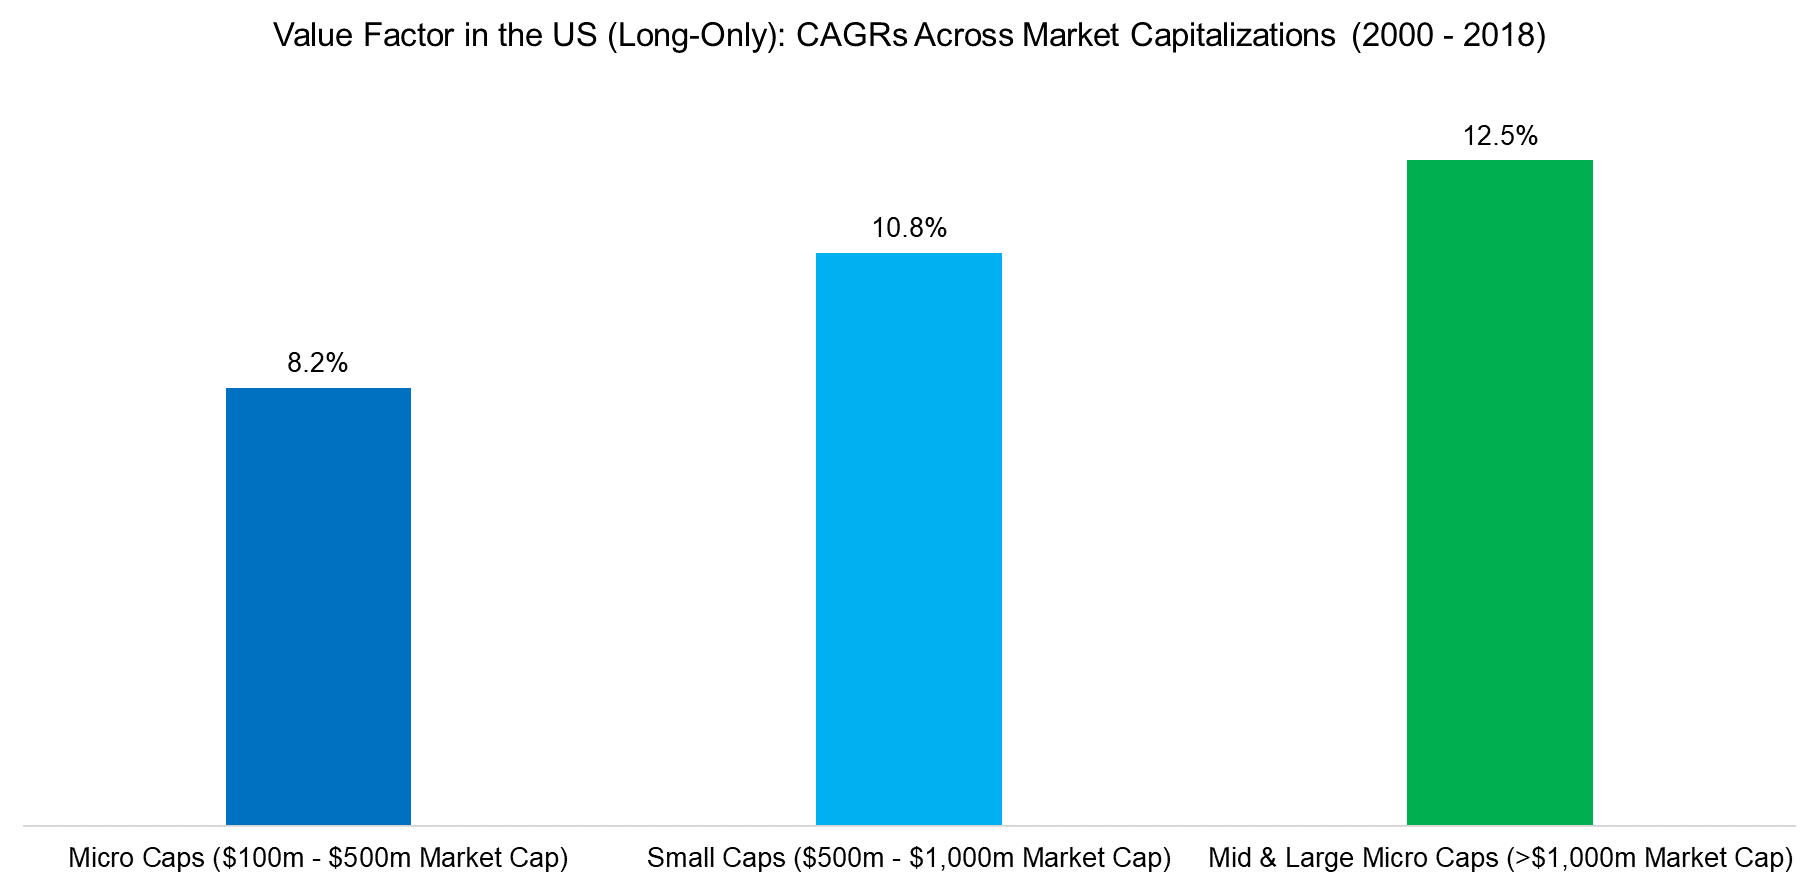
Factor investing literature frequently highlights that the returns of factors are stronger in micro and small than mid and large capitalized stocks. However, most research does not include transaction costs, which overstates returns as it is significantly more expensive trading small than large caps. If we assume transaction costs of 1.0% for micro, 0.5% for small, and 0.1% for mid and large capitalized stocks, then returns were more attractive when trading the most liquid stocks.
Related research: Factor Investing In Micro & Small Caps & Factor Returns: Small versus Large Caps
Source: FactorResearch
Value Factor Across Markets
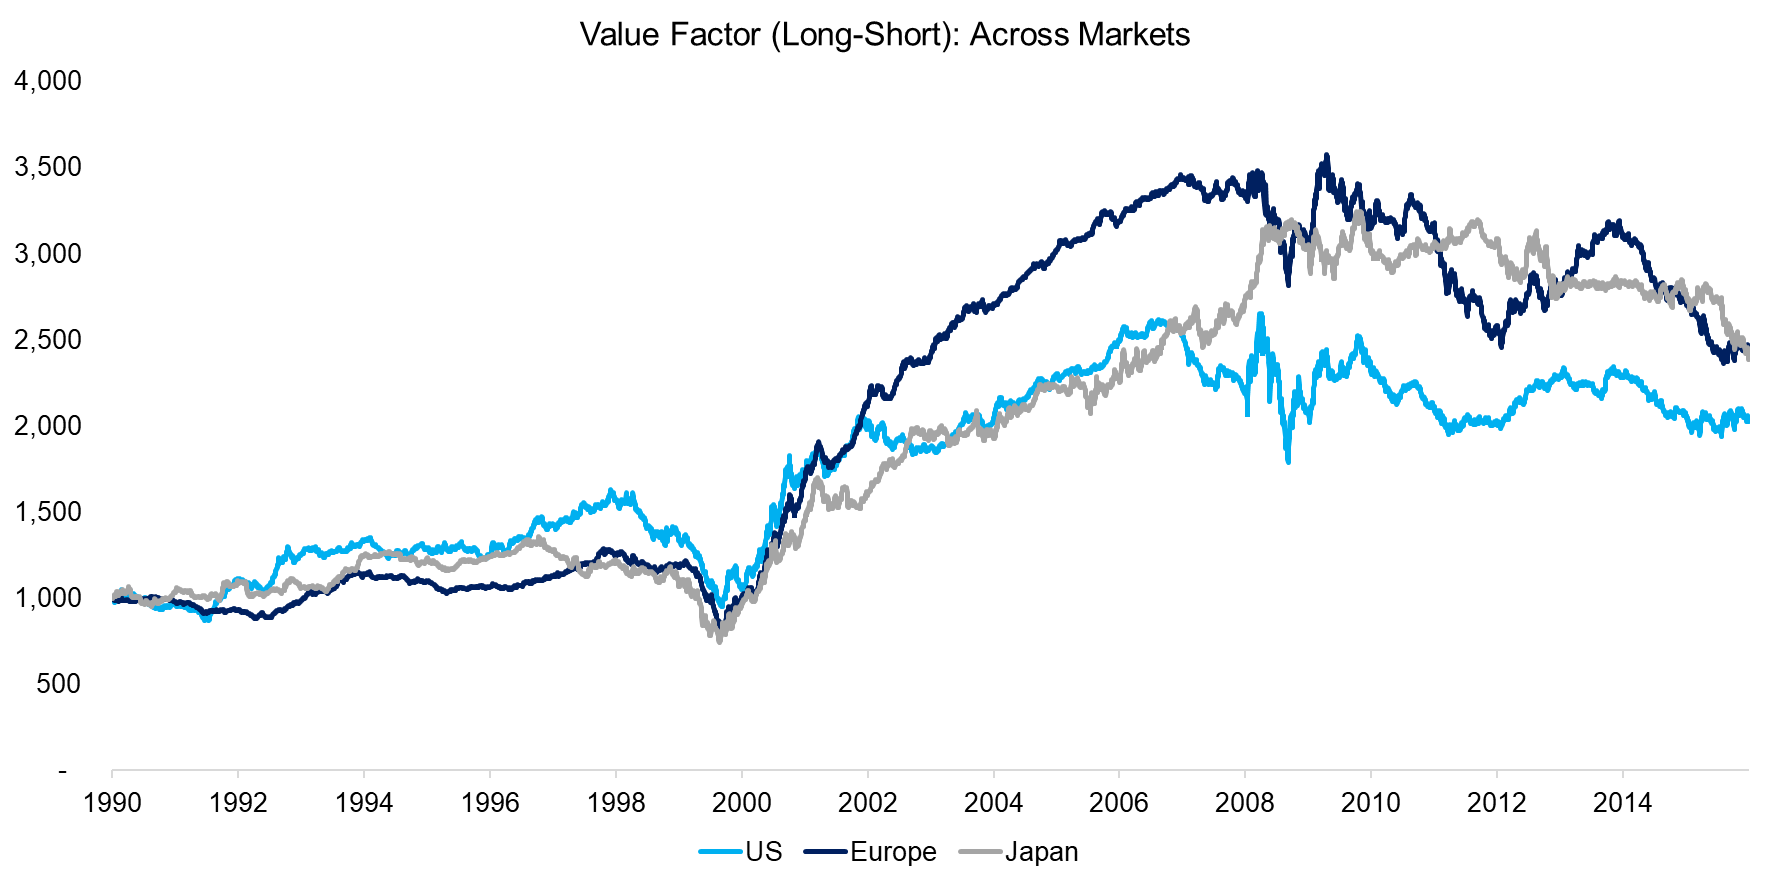
Although there has been a political pushback against globalization in some countries in recent years, financial markets are continuously becoming more integrated. When we analyze the performance of the long-short Value factor across stock markets, we observe that investors are approximately buying cheap and selling expensive stocks at the same time, which indicates global drivers of investor behavior.
Related research: Factor Olympics 2018 & Equity Factors in Japan
Source: Kenneth R. French Data Library
Value Factor: Country Versus Single Stock Level
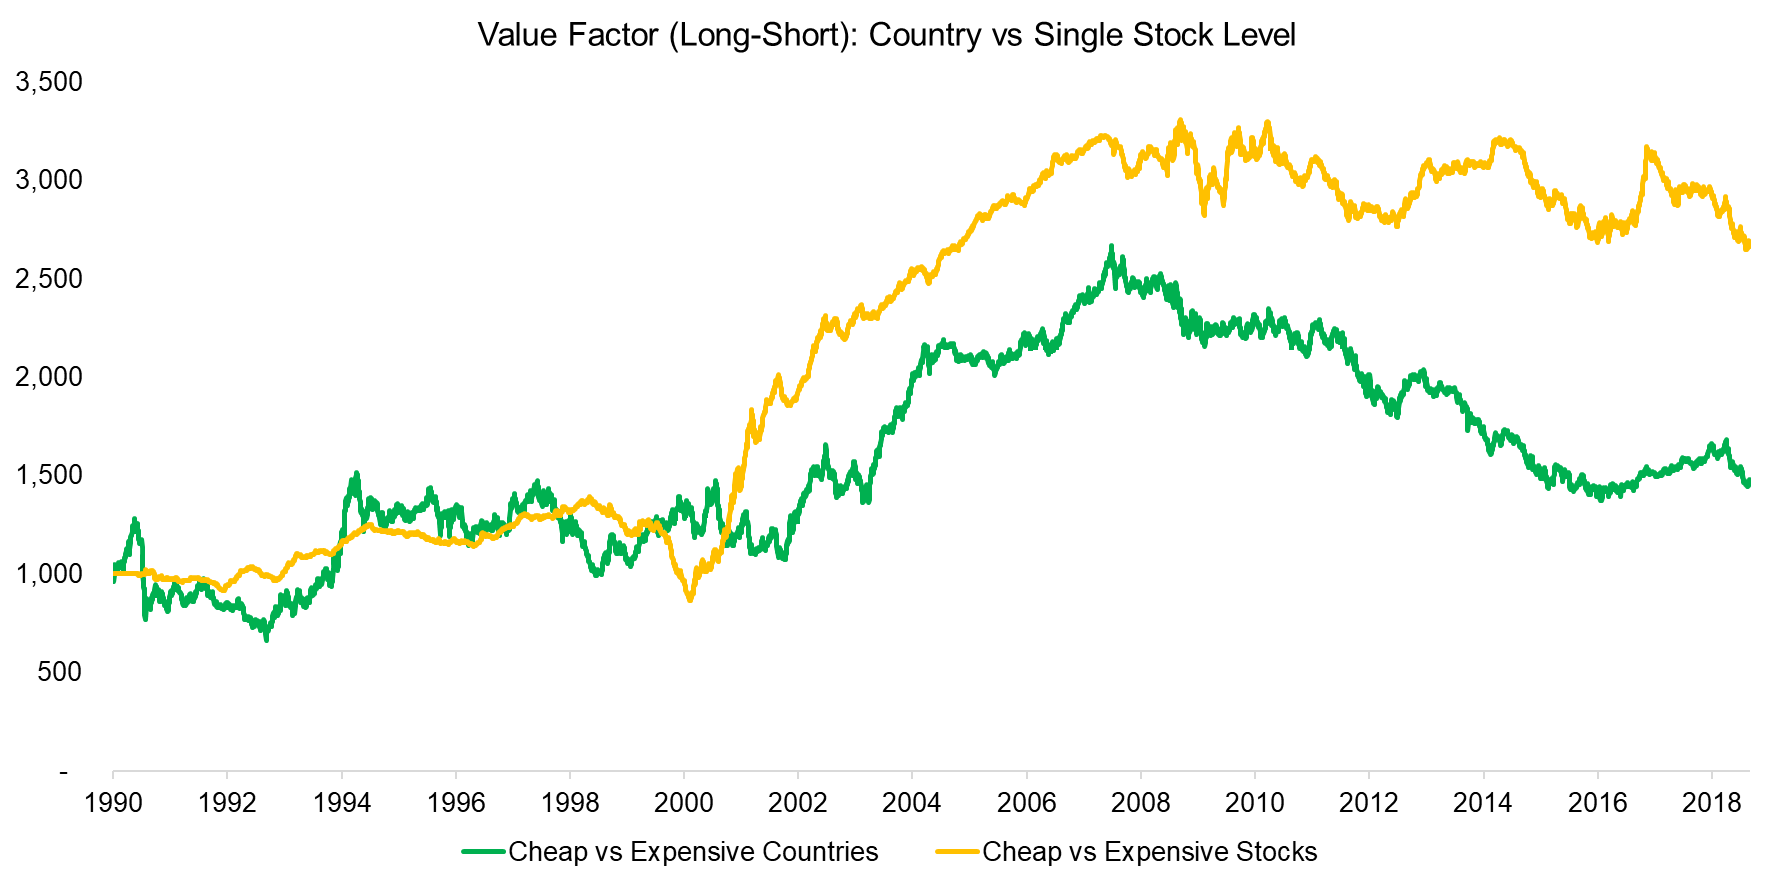
It is not only that investors tend to buy cheap stocks across stock markets at approximately the same time, but they simultaneously also increase their exposure to countries trading at low valuations, and sell expensive stocks and countries. Effectively investors in equity markets are treating stocks and countries in a similar fashion.
Related research: Cheap vs Expensive Countries
Source: Kenneth R. French Data Library, FactorResearch
Value Factor: Across Asset Classes
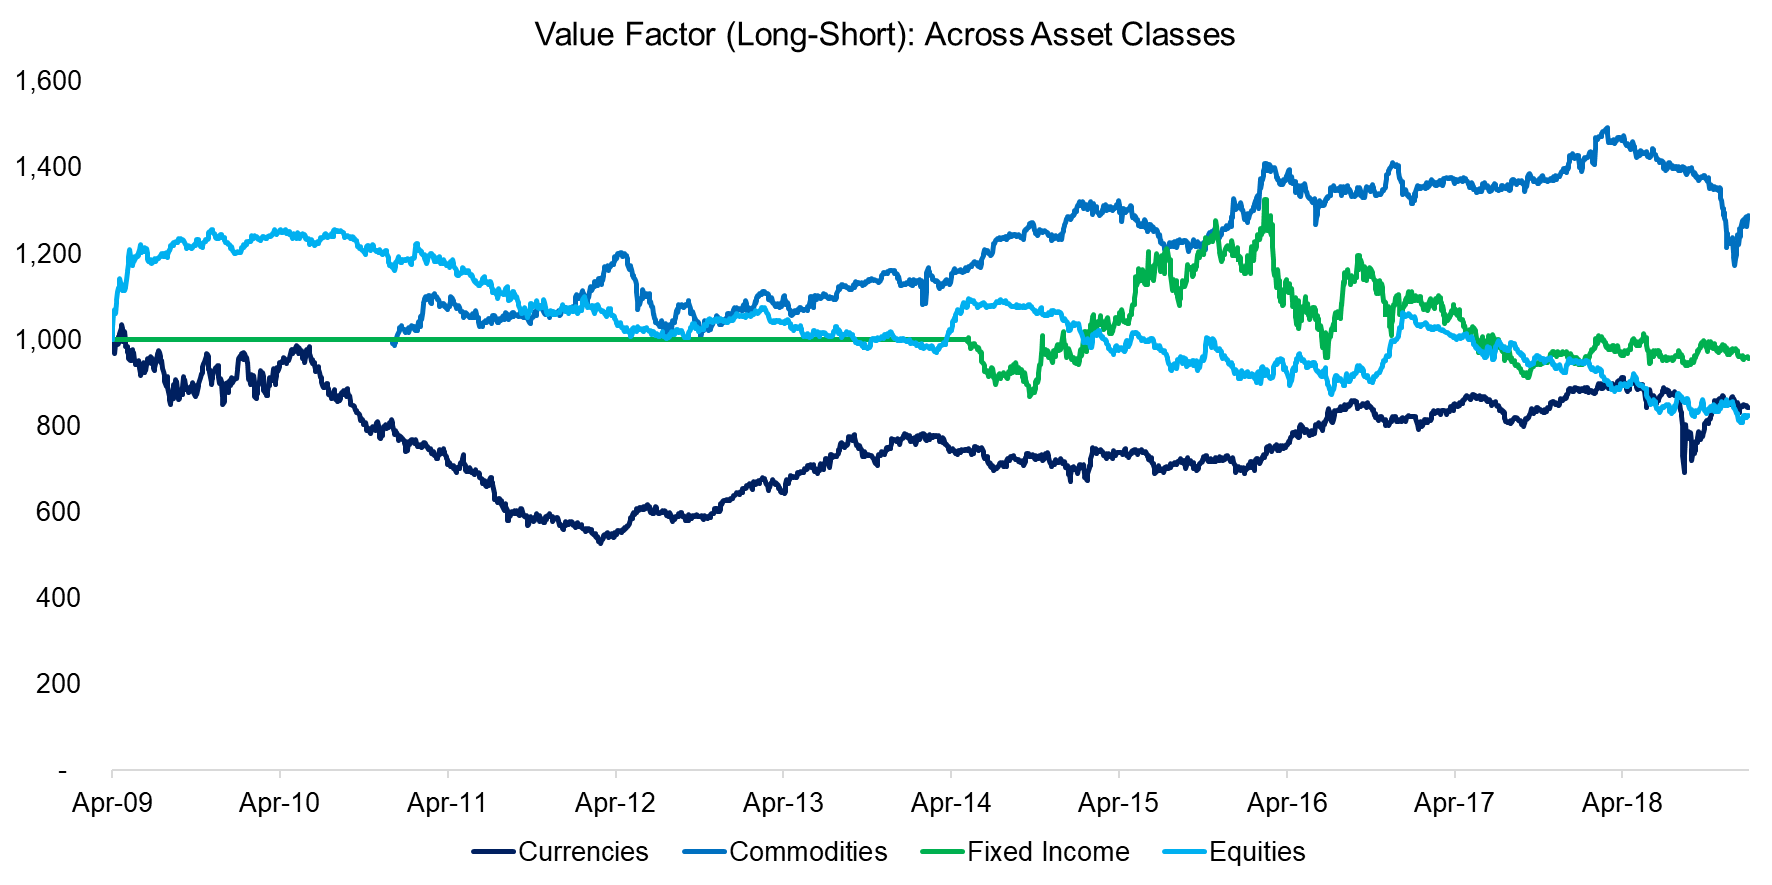
Given that investors are buying cheap and selling expensive equities at approximately the same time, we expand the analysis to other asset classes. Although we would caution reading too much into charts as it is highly subjective, it seems that Value has common trends across asset classes. The Value factor in currencies and commodities roughly track each from 2012 to 2018, which is especially pronounced in the v-shaped correction at the end of 2018.
Related research: Value, Momentum & Carry Across Asset Classes
Source: HFRX, FactorResearch
Current Framework
My current framework on the basic characteristics of the performance of the Value factor comprises the following:
- The choice of valuation metric matters, but perhaps less than most investors think
- When in doubt, go for a multi-metric model
- Value factor portfolios show structural sector biases, however, cross-sector and sector-neutral performance is comparable
- Sector biases do not explain the performance of the Value factor
- Returns are not limited to micro and small caps, in fact, are more attractive in mid and large caps after including transaction costs
- The trend of the Value factor is the same across stock markets
- Investors allocate to cheap stocks and countries at approximately the same time
- The Value factor exhibits similar trends across asset classes
This framework is relatively coherent and suggests that investors can harvest returns from the Value factor from a variety of assets. Statistically, the returns are uncorrelated, but investors should be aware that they are essentially buying the same exposure.
Further Thoughts
Given that the performance of the Value factor is similar across stock markets and asset classes, indicates one common driver that is likely related to market structure. Our research suggests that it is mainly risk sentiment that is driving the performance of the Value factor, although that framework requires further validation.
Article by Factor Research

