
- Putting International Small-Caps On the Map
- Introducing a Large Opportunity in International Small-Caps
- Strong Long-Term Relative and Absolute Performance
- Lower Volatility & Higher Risk-Adjusted Returns
- Historical Portfolio Benefits of Low Correlation
- Persistence in Beating Large-Caps
- International Small-Cap Results in Different Environments
- The Current Opportunity
- The Case for Active Management in International Small-Caps
- Conclusion
- Appendix: International Small-Caps vs Emerging Markets
Putting International Small-Caps On the Map
Our goal in this paper is to provide an introduction for asset allocators to the international small-cap asset class by detailing its attributes in terms of performance, volatility, correlation, and fundamentals.
Q3 hedge fund letters, conference, scoops etc
If you’re looking for value stocks, and exclusive access to value-focused hedge fund managers, check out ValueWalk’s exclusive value newsletter, Hidden Value Stocks.
Because asset allocators often compare international small-cap with international large-cap, we examined the long-term relative performance of these two asset classes to show the high frequency with which international small-caps outperformed their large-cap siblings.
Knowing that the risk/return trade-off is always relevant when analyzing different asset classes, we also include volatility comparisons which show that international small-cap’s superior performance record came with less incremental volatility than many financial professionals might expect.
Having shown the long-term performance advantage, we next examined how the two asset classes fared in different market environments, such as rising and falling equity markets and rising and falling interest rates. This analysis identifies that certain periods resulted in even wider positive relative return spreads for international small-caps.
To enhance international small-cap’s attractive attributes on a standalone basis, we demonstrate the benefits of adding the asset class to a global multi-asset portfolio. International small-caps have historically had a lower correlation to U.S. large caps than either international large-caps or U.S. small-caps. This lower correlation allowed international small-caps to be additive on both an absolute return and risk-adjusted return basis to a global multi-asset portfolio.
Finally, we look at some indicators that suggest, at least to us, why the current period offers an even more compelling and timely opportunity. We conclude by highlighting some fundamental factors that we believe make the asset class potentially fertile ground for active management.
Introducing a Large Opportunity in International Small-Caps
Considering that only about 1%1 of mutual fund assets in the U.S. are invested in small-caps outside the U.S., we suspect that many asset allocators think of international small-caps (if they think of them at all) as a nearly indistinguishable subset of the large non-U.S. equity universe. If this is correct, international small-caps would seem to be facing an uphill climb toward recognition as an accepted asset class, much like their stateside cousins did more than two decades ago. However, the facts tell a different story. Many asset allocators will be surprised to learn that the total market value of the companies in the Russell Global ex-U.S. Small Cap Index is twice as large as that market capitalization of the Russell 2000 Index.
1 Source: Morningstar
Compared with U.S. small-caps, there are:
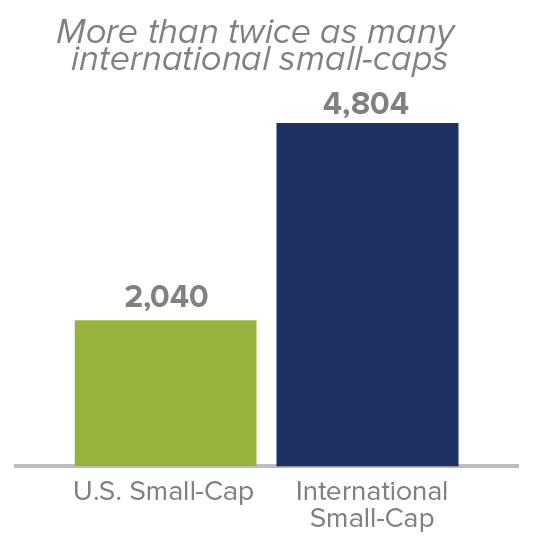
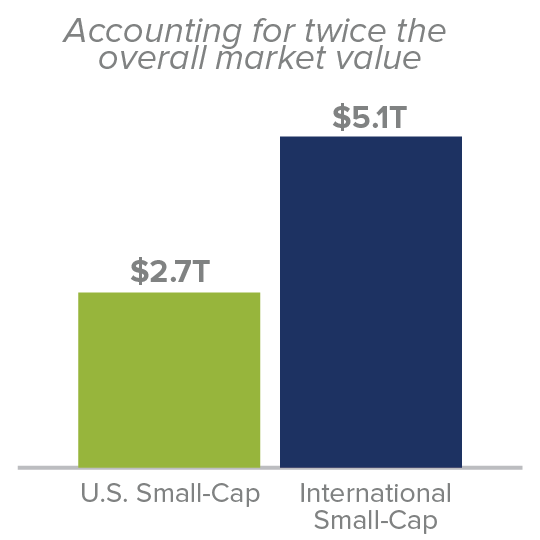
Source: FactSet as of 9/30/18 ”U.S. Small-Cap” is represented by Russell 2000, and “International Small-Cap” by Russell Global ex-U.S. Small Cap.
Strong Long-Term Relative and Absolute Performance
By market value alone, international small-caps would seem to merit consideration for inclusion in a globally diversified portfolio. However, the long-term performance record for international small-caps makes an even stronger and more compelling case for its inclusion as part of an overall equity allocation. All of the results that follow begin with the first full month of performance for the Russell Global ex-U.S. Small Cap Index on 7/1/96.
Averages of Monthly Rolling Annualized 10-Year Returns
From Russell Global Index’s First Full Month (Ended 7/31/96) through 9/30/18
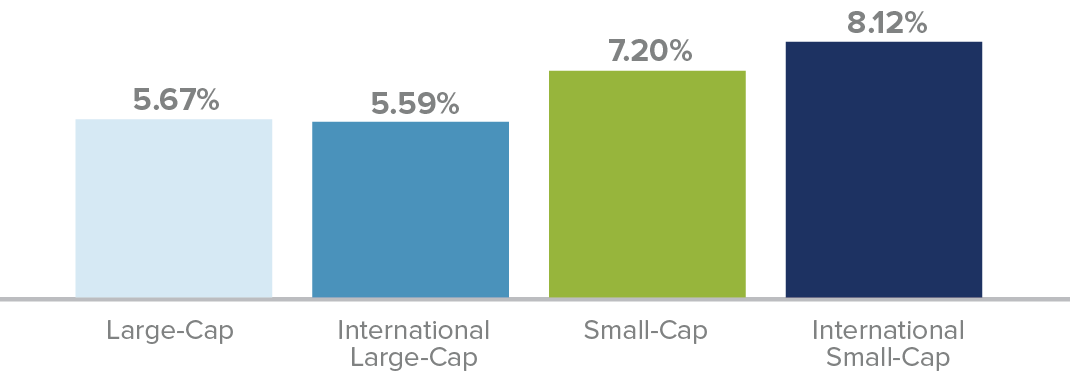
Past Performance is no guarantee of future results. “U.S. Large-Cap” is represented by Russell 1000, “International Large-Cap” by Russell Global ex-U.S. Large Cap, “U.S. Small-Cap” is represented by Russell 2000, and “International Small-Cap” by Russell Global ex-U.S. Small Cap.
Annualized rolling monthly 10-year returns for the Russell Global ex-U.S. Small Cap Index versus both its large-cap sibling, the Russell Global ex-U.S. Large Cap Index, and its domestic counterpart in the Russell 2000 Index show a clear advantage for the Russell Global ex-U.S. Small Cap Index. For additional context, we also looked at results for the large-cap Russell 1000 Index over these same periods.
Beyond this strong absolute and relative long-term performance record, international small-caps have additional attractive attributes that might be of particular relevance for asset allocators.
Lower Volatility & Higher Risk-Adjusted Returns
Like their domestic peers, international small-caps have a reputation for high volatility. Even in the context of strong performance, more cautious asset allocators might not consider an investment for fear of taking on an unacceptable level of risk for their clients. The data, however, supports a very different conclusion.
In fact, international small-caps have demonstrated lower volatility than the Russell 2000 and only marginally higher volatility than the Russell Global ex-U.S. Large Cap Index, based on rolling 10-year standard deviation.
Attractive Risk/Return Trade-Off
Average of Monthly Rolling 10-Year Periods from 7/31/96 through 9/30/18
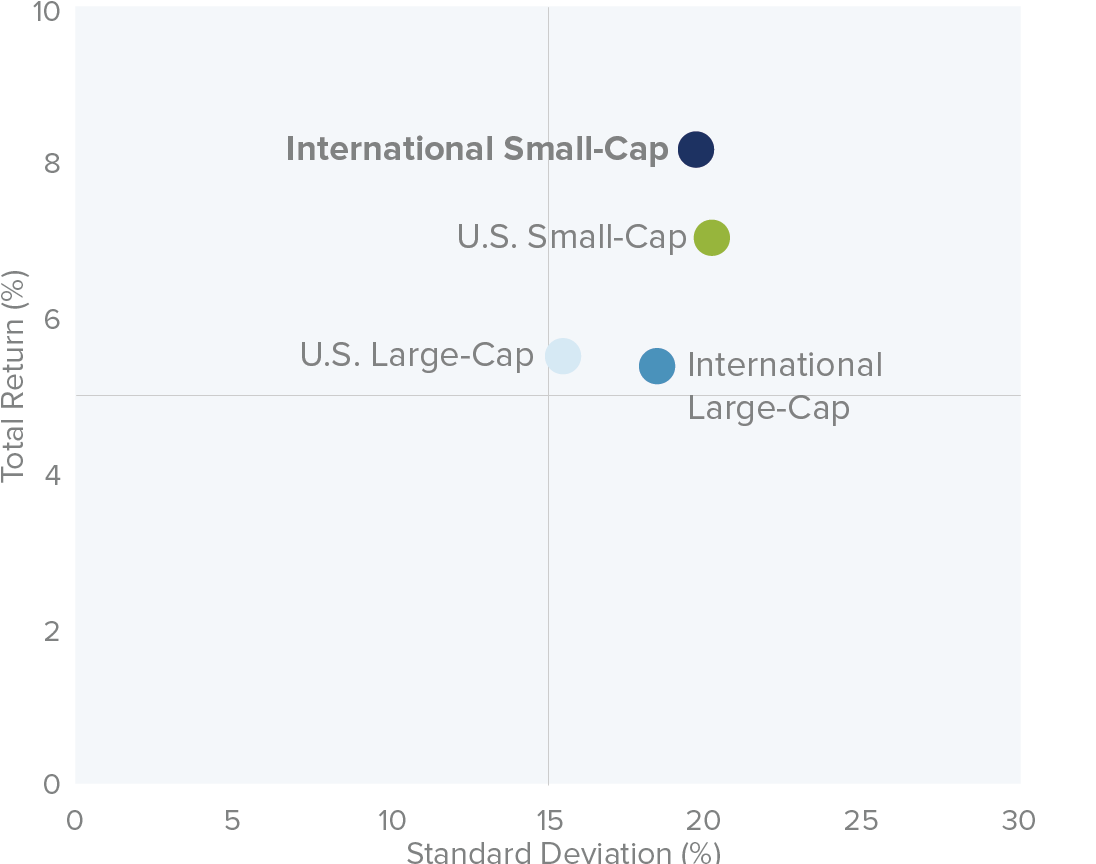
Past Performance is no guarantee of future results. “U.S. Large-Cap” is represented by Russell 1000, “International Large-Cap” by Russell Global ex-U.S. Large Cap, “U.S. Small-Cap” is represented by Russell 2000, and “International Small-Cap” by Russell Global ex-U.S. Small Cap.
Additionally, over this same rolling 10-year period, international small-caps also had the best risk-adjusted returns, as measured by Sharpe ratio, of these four asset classes.
Averages of Monthly Rolling Annualized 10-Year Sharpe Ratio
From Russell Global Indexes First Full Month (Ended 7/31/96) through 9/30/18
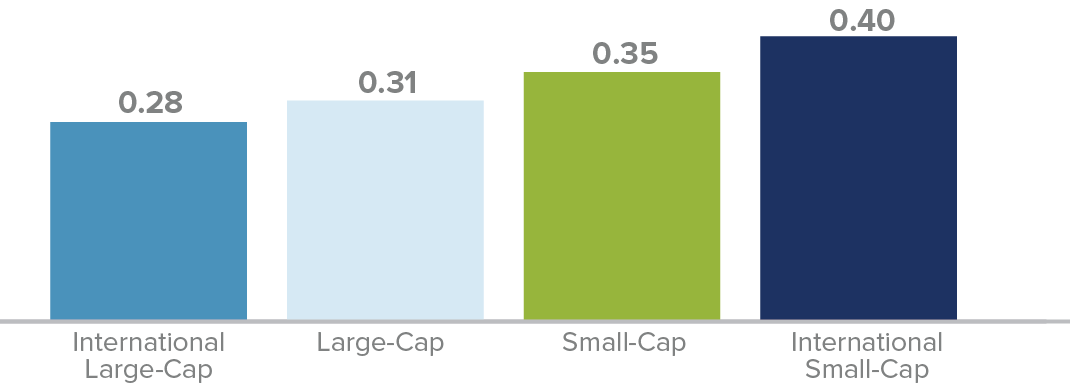
“U.S. Large-Cap” is represented by Russell 1000, “International Large-Cap” by Russell Global ex-U.S. Large Cap, “U.S. Small-Cap” is represented by Russell 2000, and “International Small-Cap” by Russell Global ex-U.S. Small Cap.
When considering the volatility of the international small-cap index, we think it’s useful to recall that it is composed of a globally diverse set of companies in 44 countries that rarely occupy the same place in their respective economic cycles. This geographic diversification helps to dampen the price volatility of any specific security, and in our view, compensates for the lower average market cap for the Russell Global ex-U.S. Small Cap versus the Russell 2000. Also helping to potentially reduce volatility is the prevalence of dividend-paying companies. Approximately 85% of the companies in the Russell Global ex-U.S. Small Cap paid dividends as of 7/31/18.1
1 There can be no assurance that companies that currently pay a dividend will continue to do so in the future.
Historical Portfolio Benefits of Low Correlation
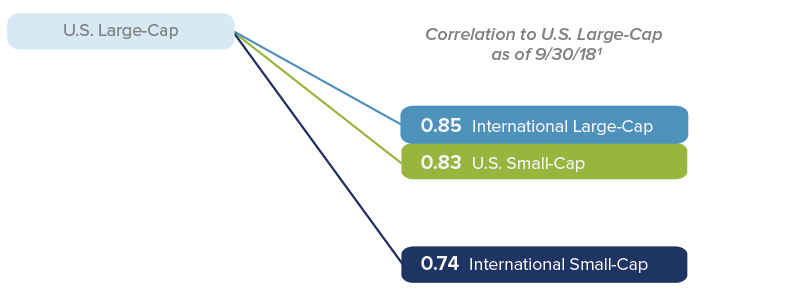
As one might expect, international small-caps have a lower correlation to U.S. larger-caps than either international large-caps or U.S. small-caps.
Lower correlation to U.S. larger caps than either international large-caps or U.S. small-caps
1 Correlation of monthly returns from 7/31/96 through 9/30/18
To test the performance and volatility effects this lower correlation might have, we ran results for two hypothetical multi-asset portfolios. For each, we charted hypothetical returns (measured by the growth of $10,000), standard deviation, and Sharpe ratio. Both portfolios were rebalanced quarterly and encompassed the same time period, 7/31/96-9/30/18.
The first portfolio we constructed had 40% of its assets in bonds and 60% in stocks, with the latter allocated evenly among domestic large-caps, domestic small-caps, and international large-caps.
In the second portfolio, we made only one change—we swapped the international large-cap allocation for an allocation to international small-caps. The results are below.
Hypothetical Portfolios — Asset Allocation
Quarterly Rebalanced, From 7/31/96 through 9/30/18
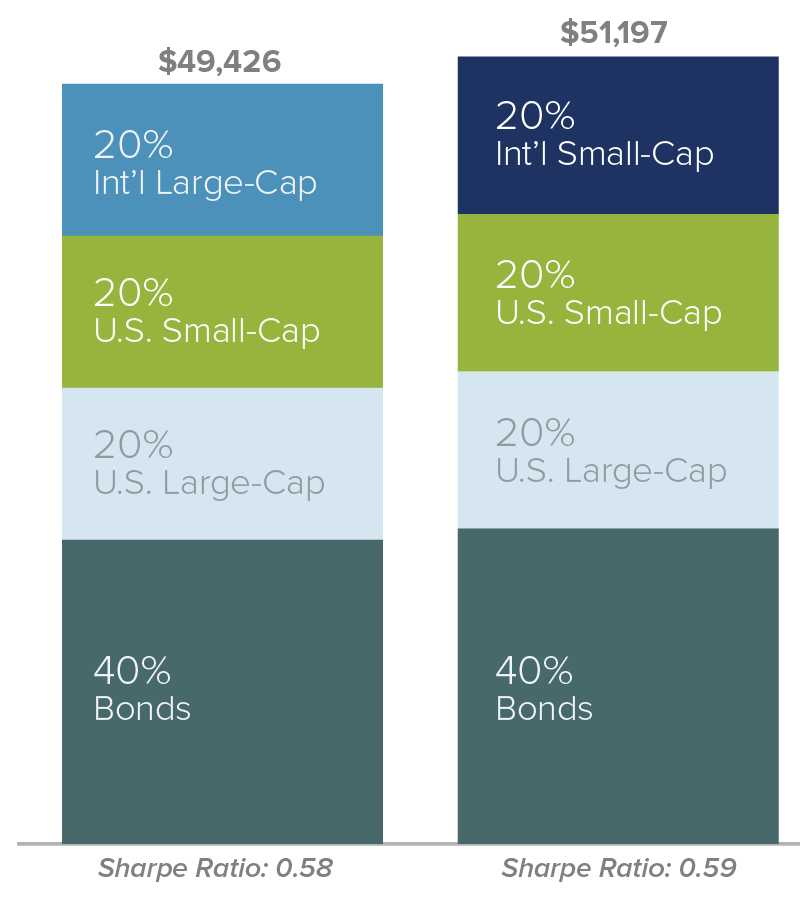
While both multi-asset hypothetical portfolios showed strong standard and risk-adjusted performance, the portfolio with the international small-cap allocation had higher returns and risk-adjusted returns as well as lower volatility.
This is as strong an argument as we believe can be made in favor of allocating to international small-cap stocks.
“Bonds” are represented by Bloomberg Barclays US Aggregate, “U.S. Large-Cap” by Russell 1000, “U.S. Small-Cap” by Russell 2000, “Int’l Large-Cap” by Russell Global ex-U.S. Large Cap, “Int’l Small-Cap” by Russell Global ex-U.S. Small Cap. The above chart is shown for illustrative purposes only and does not reflect the past performance, or project the future performance, of any investment. The performance of an index, such as those used above, does not represent any particular investment as you cannot invest in an index.
The Sharpe Ratio is calculated for a specified period by dividing an investment’s annualized excess returns by its annualized standard deviation. The higher the Sharpe Ratio, the better the investment’s historical risk-adjusted performance.
Persistence in Beating Large-Caps
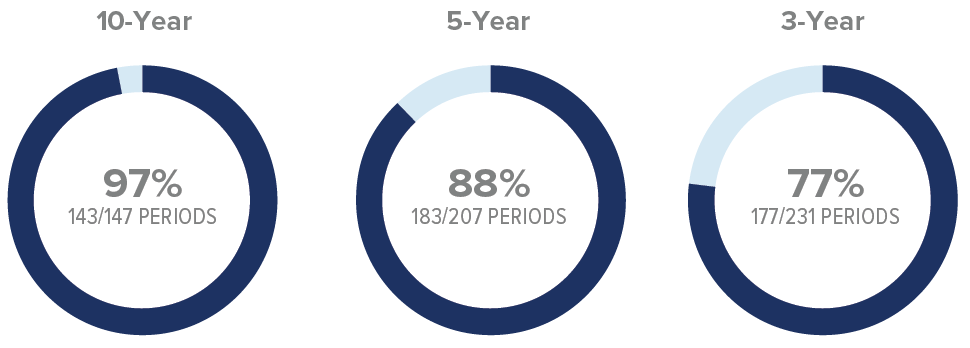
Because many investors split their international equity allocation between small- and large-cap stocks, we think it’s important to be aware of the longer-term relative performance history. International small-caps have beaten their large-cap siblings in 77% of rolling three-year periods, 88% of rolling five-year periods, and 97% of rolling 10-year periods.
Batting Average of International Small-Cap vs International-Large Cap
Rus Glo ex US SC vs Rus Glo ex US LC Monthly Rolling Average Annual Return Periods from the Index Inception through 9/30/18
International Small-Cap Results in Different Environments
While international small-caps outperformed large-caps over most rolling time periods, there were market conditions in which the performance spread was greater than others. We analyzed monthly trailing one-year data from 7/31/96-9/30/18, a span that yielded 255 periods.
First, we examined both positive and negative return periods for the international all-cap index to see how non-U.S. small-caps performed versus their large-cap peers. The result was a relative advantage for the Russell Global ex-U.S. Small Cap Index in both negative and positive return periods for non-U.S. stocks. We then broadened our scope, examining returns for the small- and large-cap indexes when the 10-year German Bund yield was rising and falling:
| International Small-Cap vs International Large-Cap in Different Market Environments Rus Glo ex US SC vs Rus Glo ex US LC Monthly Rolling Trailing 1-year Periods from 7/31/96 through 9/30/18 |
||||||
| MARKET ENVIRONMENTS | PERIODS INT’L SMALL-CAP BEAT INT’L LARGE-CAP | BATTING AVG | INT’L SMALL-CAP | INT’L LARGE-CAP | AVG SPREAD | |
| International Equity | Positive | 114/176 | 65% | 20.4 | 18.8% | 1.6% |
| Negative | 50/79 | 63% | -14.5% | -16.3% | 1.8% | |
| 10-Year German Bund | Rising | 62/92 | 67% | 22.7% | 19.3% | 3.4% |
| Falling | 102/163 | 63% | 2.2% | 1.5% | 0.7% | |
“International Equity” is represented by the Russell Global ex-U.S. Index.
International small-caps outperformed their large-cap counterparts in both rising and falling rate environments, but the absolute return level and relative return spread were each significantly different. The best results for U.S. dollar investors came when German Bund Yields were rising. This is possibly due to three overlapping factors: bond yields usually rise when economies are improving, international small-caps have more cyclical exposure than international large-caps, and rising Bund Yields often occur in periods of U.S. dollar weakness, resulting in enhanced gains for U.S. dollar investors.
In each of the four scenarios shown above, the advantage went overwhelmingly to small-cap. We think the results of our research therefore present a strong argument for making a strategic allocation to international small-cap stocks.
The Current Opportunity
Among the other compelling reasons to consider allocating to international small-caps is the timeliness of the opportunity. Prior to 2017, the Russell Global ex-U.S. Small Cap had underperformed the Russell 2000 by the widest spread since the inception of the non-U.S. small-cap index. As of 6/30/18, the performance spread between the two indexes reached a low point.
International Small-Caps Poised for a Rebound?
Russell Global ex-U.S. Small Cap vs Russell 2000 Annualized Trailing 10-Year Relative Return Spread as of 9/30/18
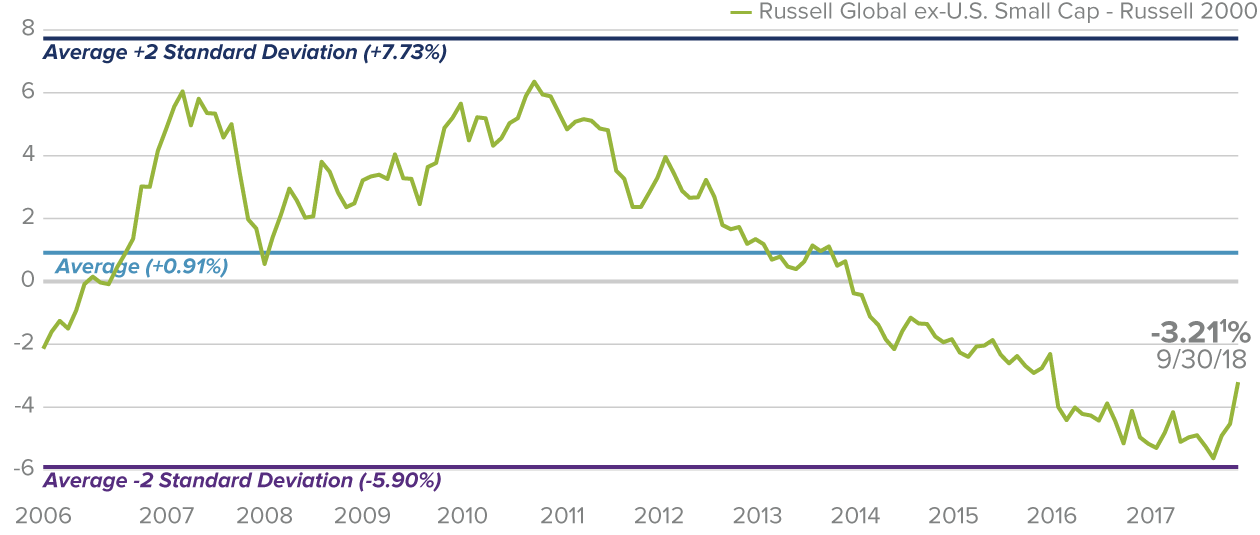
The 10-year average annual total return through 9/30/18 was 7.90% for the Russell Global ex-U.S. Small Cap and 11.11% for the Russell 2000, -3.21% represents the difference.
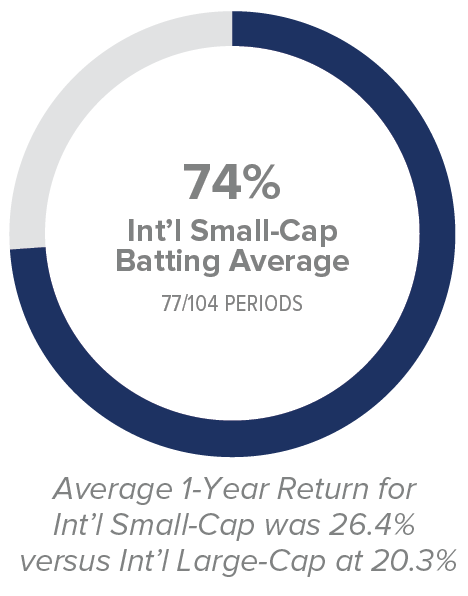
It’s worth mentioning that when these stocks as a whole outpaced their domestic cousins, international small-cap outperformed their large-cap peers 74% of the time—and by an average spread of 6.1%—for all monthly rolling one-year periods from 7/31/96 through 9/30/18.
When International Has Outperformed U.S.
Monthly Rolling Trailing 1-year Periods from the Index Inception (7/31/96) through 9/30/18
“U.S.” is represented by the Russell 3000 Index and “International” by the Russell Global ex-U.S. Index. “Int’l Large-Cap” is represented by the Russell Global ex U.S. Large-Cap Index and “Int’l Small-Cap” by the Russell Global ex U.S. Small-Cap Index.
The historical data suggests, then, that relatively good periods for international stocks mean relatively better periods for international small-caps. So while there is no guarantee of the course of future returns, we think the long-term performance history of the two small-cap indexes suggests that a multi-year run for international small-caps is possible. In our view, this is especially relevant when evaluating the opportunity in non-U.S. small-caps.
The Case for Active Management in International Small-Caps
Do the attractive attributes of international small-caps also offer the potential for active managers to improve on these results? We believe they do, based on the following:
A Large and Diverse Asset Class
There are more than twice as many international small-caps as domestic small-caps, providing ample opportunity for active managers to search for mispriced stocks. Further, international small-caps offer access to local, regional, and global businesses hailing from a diverse group of countries that collectively account for 75% of global GDP.
An Inefficient Asset Class
More than 36% of the companies in the Russell Global ex-U.S. Small Cap were receiving one or no sell-side analyst coverage versus 16% for those in the Russell 2000 as of 9/30/18.1 This provides an active manager with a potentially sizable analytic advantage.
High ROIC Companies
Historical returns of the international small-cap index’s high-profitability companies, based on ROIC, have markedly exceeded those for the index as a whole. The average annual total return for the top ROIC decile of non-U.S. small-cap stocks was 12.2% from 7/31/96-9/30/18, compared to 6.3% for the overall index over the same period. This suggests to us that an active management approach focusing on companies with higher profitability and sustainability can enhance the potential for higher returns.2
1 Source: Factset
2 Return on Invested Capital is calculated by dividing a company’s past 12 months of operating income (earnings before interest and taxes) by its average invested capital (total equity, less cash and cash equivalents, plus total debt, minority interest, and preferred stock). The portfolio calculation is a simple weighted average that excludes cash, all non-equity securities, investment companies, and securities in the Financials sector with the exceptions of the asset management & custody banks and insurance brokers sub-industries. The portfolio calculation also eliminates outliers by applying the inter-quartile method of outlier removal.
Companies with Earnings
Loss-making international small-cap companies have historically lagged. In fact, companies with positive earnings have outperformed the international small-cap index, gaining 8.2% versus 6.3% on an average annual total return basis from 7/31/96-9/30/18. A manager who focuses on non-U.S. small-caps with established histories of earnings may also be able to potentially enhance returns.
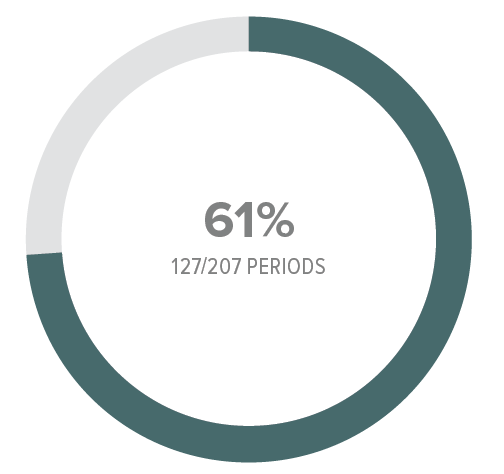
Historical Performance of Active International Small-Cap Funds
This research reveals what we believe are among the most important and attractive attributes of the international small-cap universe that also highlights its potential appeal for active managers. We then asked, what does the history show? We compared performance for the average international smal-cap mutual fund, using Morningstar’s International Small/Mid Cap Blend average, to the Russell Global ex-US Small Cap index over rolling five-year periods. The majority of the time, 61% of the 207 periods since the index’s inception in 1996, the average international small-cap blend fund beat the index with average annual five-year returns that were about 100 bps higher net of all fees for the mutual funds. This shows that the actual relative performance history aligns with the attribute research—both suggest that international small-caps may present a fruitful opportunity for active managers.
U.S. Fund Foreign Small/Mid Blend 1 Outperformed the Russell Global ex-U.S. Small-Cap Index
Monthly Rolling Average Annual Return 5-Year Periods From 7/31/96 through 9/30/18
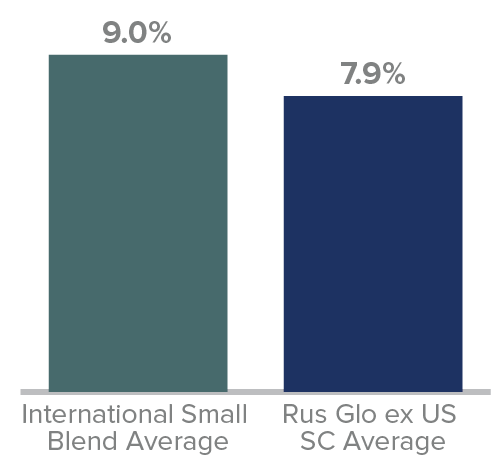
International Small Blend outperformed in 60% of 10-year periods (88/147) with average of 8.8% vs Russell Glo ex US SC average of 8.1%
This research also shows that the universe of non-U.S. small-cap stocks is a fruitful starting point, giving active managers a number of opportunities to potentially prune the list of investment candidates.
¹There were 208 US Fund Foreign Small/Mid Blend Funds tracked by Morningstar with at least five years of performance history as of 9/30/18.
The performance data and trends outlined in this presentation are presented for illustrative purposes only. Past performance is no guarantee of future results. Historical market trends are not necessarily indicative of future market movements.
Source: Morningstar
Conclusion
We think that the combination of strong absolute and attractive relative performance, low correlation to both international large-caps and U.S. small-caps, and strong results in a number of different market environments makes a very strong case for including international small-caps in a globally diversified portfolio. In our view, the timeliness of the opportunity serves to bolster an already compelling case. Finally, we suggest asset allocators should consider the potential advantages active management can offer within the asset class based on both the historical strength of certain fundamentals and the overall inefficiency of this large and diverse group of small-cap stocks.
Appendix: International Small-Caps vs Emerging Markets
While we believe that our research makes a clear and compelling case for an international small-cap allocation, we understand that some investors will also want to know how the asset class has fared relative to emerging market stocks. This may be of particular relevance given that emerging markets equities have a similar reputation to small-cap stocks for both high returns and high risk.
When we examined the history of these two asset classes, the results were consistent with our expectations. While emerging market companies mostly delivered slightly higher returns, they did so with considerably more risk. For example, based on rolling monthly five-year returns, both emerging market stocks and international small-caps returned 7.9%. However, the emerging markets return came with significantly higher volatility—a standard deviation of 22.9% for emerging market stocks vs. 18.1% for international small-caps.
International Small-Cap: Comparable Return and Lower Risk than Emerging Markets
Average of Monthly Rolling 5-Year Periods 7/31/96–9/30/18
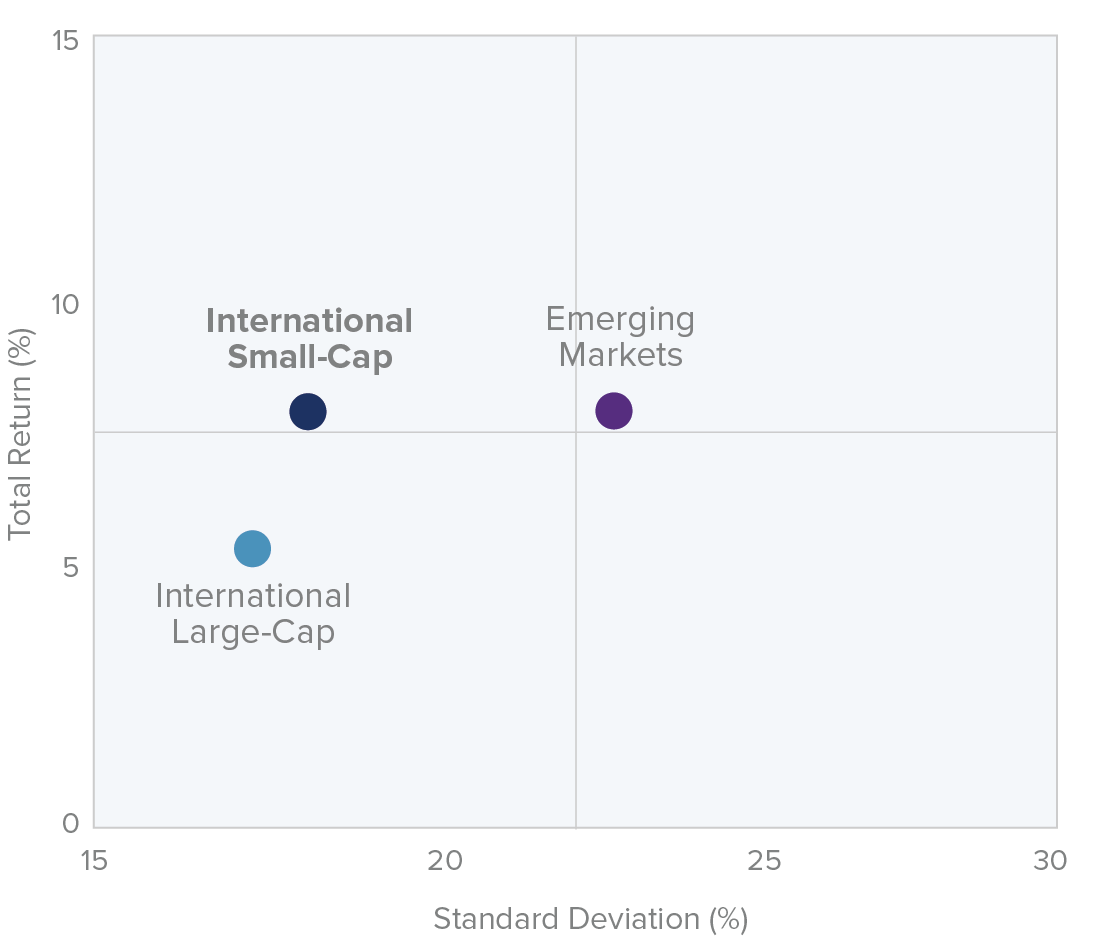
Past Performance is no guarantee of future results. “International Large-Cap” is represented by the Russell Global ex U.S. Large-Cap Index, “International Small-Cap” by the Russell Global ex U.S. Small-Cap Index, and “Emerging Markets” by the Russell Emerging Markets Index.
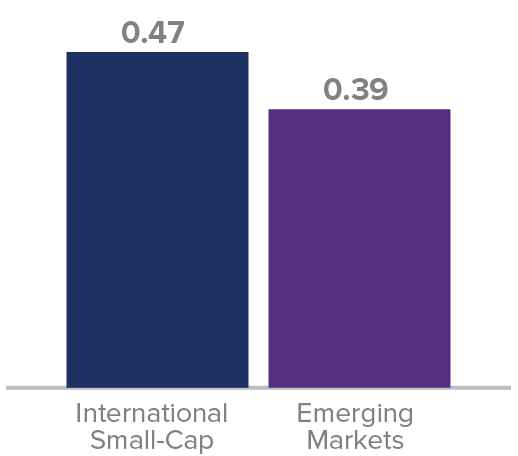
As one might guess, emerging market stocks’ combination of slightly higher returns with substantially higher volatility meant that international small-caps had a higher rolling monthly five-year risk-adjusted return.
Sharpe Ratio
Average of Monthly Rolling 5-Year Periods from 7/31/96 through 9/30/18
The heightened risks of emerging market stocks manifested itself most vividly perhaps by having deeper declines during down markets. There were six declines of 15% or more since the inception of the Russell international indexes. During these six periods, the median decline for international small-cap stocks was 25.3% versus 33.7% for emerging market stocks—which declined more in every one of those six periods. These deeper declines could create challenges for investors trying to stay the course for as long as is needed to achieve their long-term objectives.
Down Market Performance Comparison as of 9/30/18
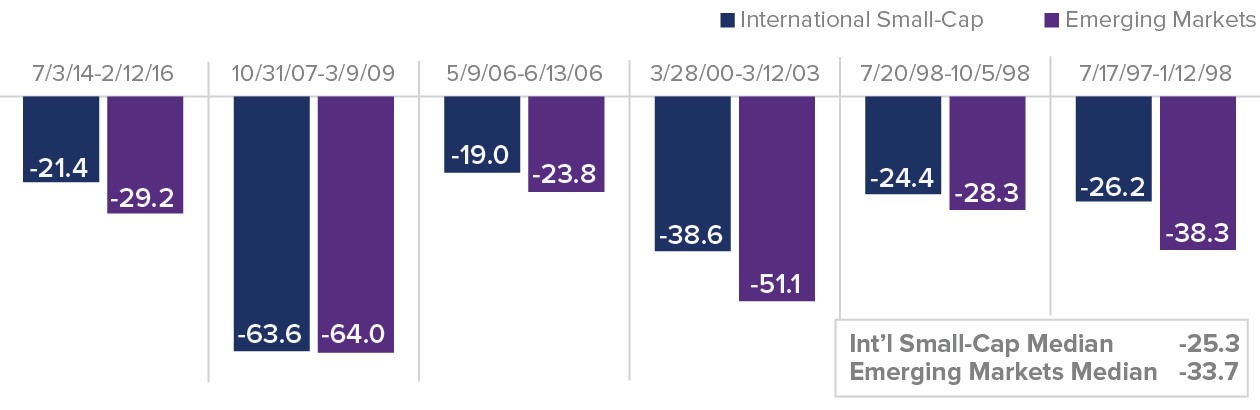
“International Small-Cap” is represented by the Russell Global ex U.S. Small-Cap Index and “Emerging Markets” by the Russell Emerging Markets Index.
Overall, we suggest that a strategic allocation to international small-caps is an attractive option for asset allocators to consider—the asset class had significantly higher returns with modestly higher risk than international large-caps along with modestly lower returns but significantly lower risk than emerging market equities
Article by The Royce Funds

