
On July 21, 2020, this article was corrected to attribute the term “animal spirits” to John Maynard Keynes instead of Adam Smith.
Q2 2020 hedge fund letters, conferences and more
What return can I expect from my stock investments over the next 10 years?
The most common answer is to use the historical average. The geometric average historical return on the S&P 500 is about 10%.
Is it reasonable, then, to project 10% stock returns?
Another method is to consider the valuation of stocks. If stocks are at a higher price than their historical average as a multiple of recent earnings, can we then expect a lower return than we have in the past?
Can valuations predict future earnings?
There have been a number of recent criticisms of Robert Shiller’s measure of stock valuation – the cyclically-adjusted price to earnings ratio (CAPE) – as a predictor of future stock returns. A 2017 Advisor Perspectives article pointed out that the ratio wasn’t a realistic measure of future stock returns because 10-year earnings included the global financial crisis. Others have argued that changes in accounting rules mean that you can’t compare today’s CAPE to historical CAPE. An analysis by Vanguard found that the R-squared, or predictive ability, of the Shiller CAPE and 10-year returns between 1926 and 2011 was 0.43. Although 0.43 is high for an asset whose returns are assumed to be random, it gives CAPE critics a reason to dismiss its value.
Care to guess how well the monthly CAPE predicted future 10-year returns between January 1995 and May 2020?
In a period where accounting rules changed and the 2008 global financial crisis decimated profits, CAPE explained 90% of the variation in 10-year returns. Here’s what it looks like when I model 10-year nominal, annualized, geometric returns starting every month from January 1995 through June 2010 (185 blue dots) as a function of their CAPE value during this period:
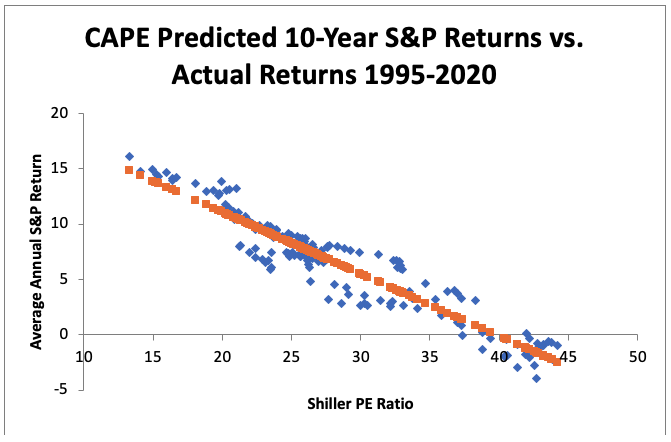
The standard deviation of the error (how far off the prediction was from the actual value) is 1.37%. This is the difference between the predicted annual return (the yellow dot) and the actual return (the blue dot) at each initial Shiller PE ratio. In other words, 67% of the time the return was plus or minus 1.37% from the CAPE model prediction; and 95% of the time the actual return was within 2.74% of the future 10-year predicted returns. CAPE’s ability to predict 10-year future returns during the last 25 years has been remarkable.
Read the full article here by Michael Finke, Advisor Perspectives

