
Here’s some of the standout economic and markets charts on my radar (originally posted on LinkedIn). I aim to pick a good mix of charts covering key global macro trends, and ones which highlight risks and opportunities across asset classes.
Q4 hedge fund letters, conference, scoops etc

Hope you enjoy!
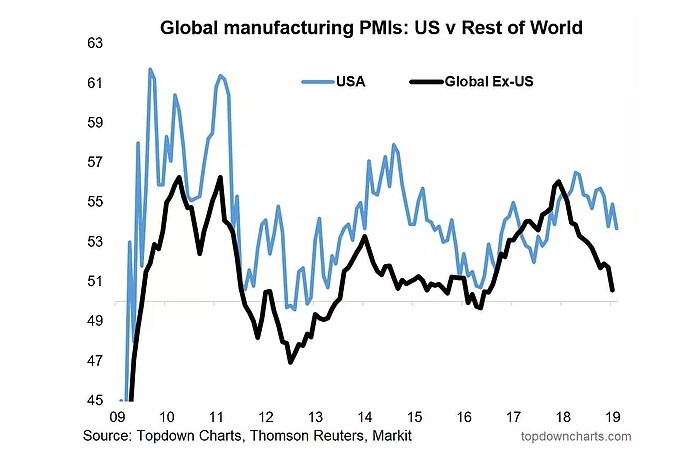
1. Global Manufacturing PMIs — USA vs Rest of World: This is probably one of my most interesting economic charts right now; the divergence between the US and rest of the world.
We can have a pretty high degree of confidence that the gap here will close, it just comes down to how: Option A. US “catches down” to softer global growth; or Option B. the rest of the world catches back up (through a combination of stimulus and fading sentiment effects).
The truth will probably be a mix of the two. Certainly one to keep a close eye on.
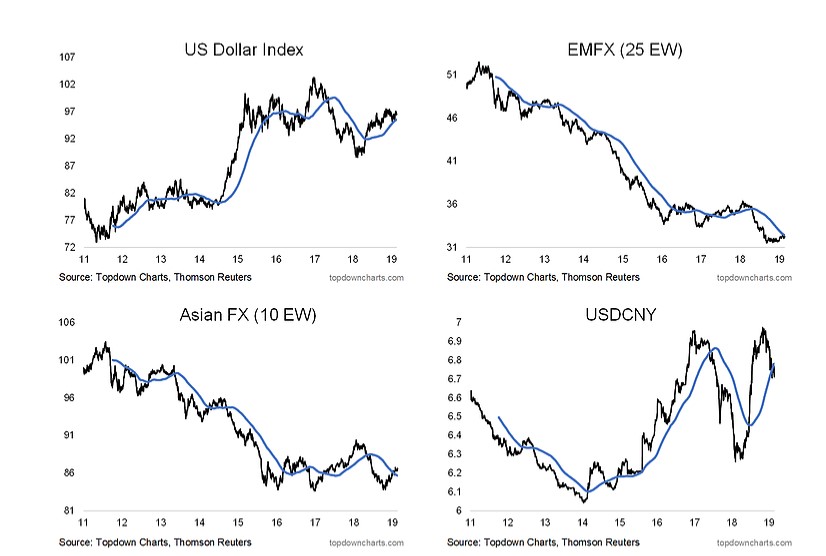
2. USDCNY:I wanted to include something on the USDCNY, and I have quite a few charts on the pair itself… but I thought about it, and if the rumors about a USDCNY element to a possible China-USA trade deal are true, then it could have more wider reaching implications than just for the USDCNY. (rumor is that a stronger/strong Renminbi will be part of the trade deal)
The 4 charts below are from my Global Cross Asset Market Monitor and basically what I was hinting at is that if we do see a Renminbi strength clause in the trade deal it’s likely to have spillover effects on all 4 charts: it could well be a catalyst to a weaker US dollar, and stronger Asian and EM currencies (and arguably the case is already there for this to playout).
So watch this space.
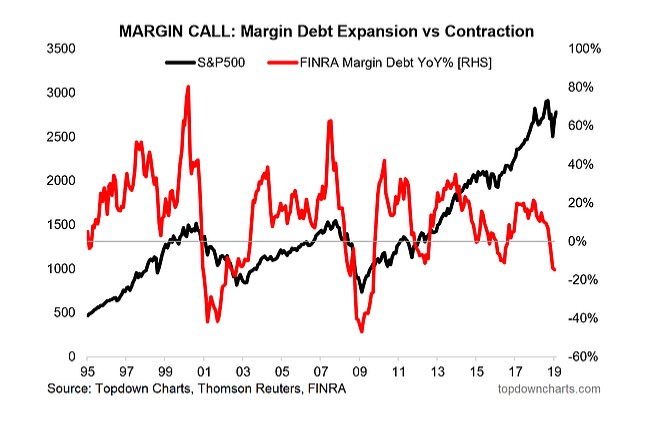
3. Margin Call — Margin Debt Accelerometer: Here’s an interesting chart, basically a bear market warning indicator; the year over year change in US margin debt [note it used to be called NYSE margin debt, but now FINRA publishes a broader set of data].
The basic concept is that when margin debt is contracting on an annual basis it can serve as a bear market warning signal (margin calls and lower risk appetite).
Only thing I would add is that in the 2000 & 2008 experiences there was a substantial acceleration in margin debt growth before the contraction signal was triggered, so one might argue the lack of that acceleration weakens the signal this time around…
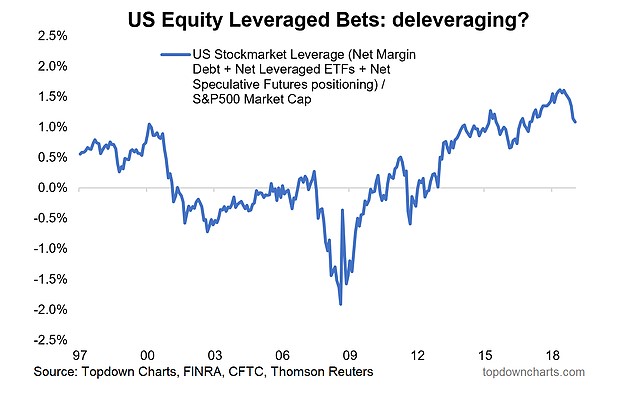
4. US Stockmarket Leveraged Bets: Continuing with margin debt, here’s a view of net margin balances along with net leveraged ETF AUM and net speculative futures positioning standardized against the S&P500 market cap.
Intriguingly, on this lens, leveraged bets reached an all time high last year. On the bright side, there has been some deleveraging….
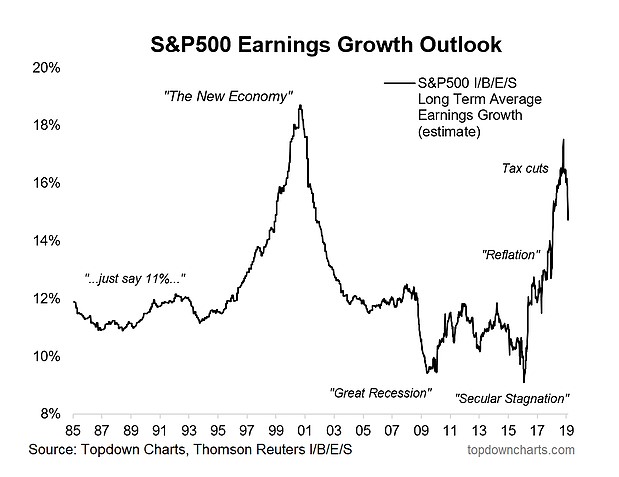
5. S&P500 Long Term Earnings Growth:Last chart for this week shows a sort of bursting of the earnings hype bubble. The chart comes from the I/B/E/S data from Thomson Reuters datastream (now called Refinitiv), and shows the consensus long term average earnings growth estimate.
The chart and the annotations kind of speak for themselves, so I’ll leave you to dwell and ponder (and comment!) on this…
Thanks for reading, I appreciate your interest in my work.
This article was originally posted by me on LinkedIn. Be sure to connect with us there too.
Article by Top Down Charts

