
In times of change, learners inherit the earth; while the learned find themselves beautifully equipped to deal with a world that no longer exists. ~ Eric Hoffer
In this week’s Dirty Dozen [CHART PACK], we again make the case to not fight the upside trend in equity markets, we then talk bearish CoT positioning in SPX mixed with rising speculative frenzy in “AI stocks” and what that may mean for forward returns in the space… we then cover market cap concentration, seasonality, USDCNH devaluation, and precious metals, plus more…
Q1 2023 hedge fund letters, conferences and more
- Dull markets that act as a duck’s back to the incessant flow of bad news, tend to keep going up…
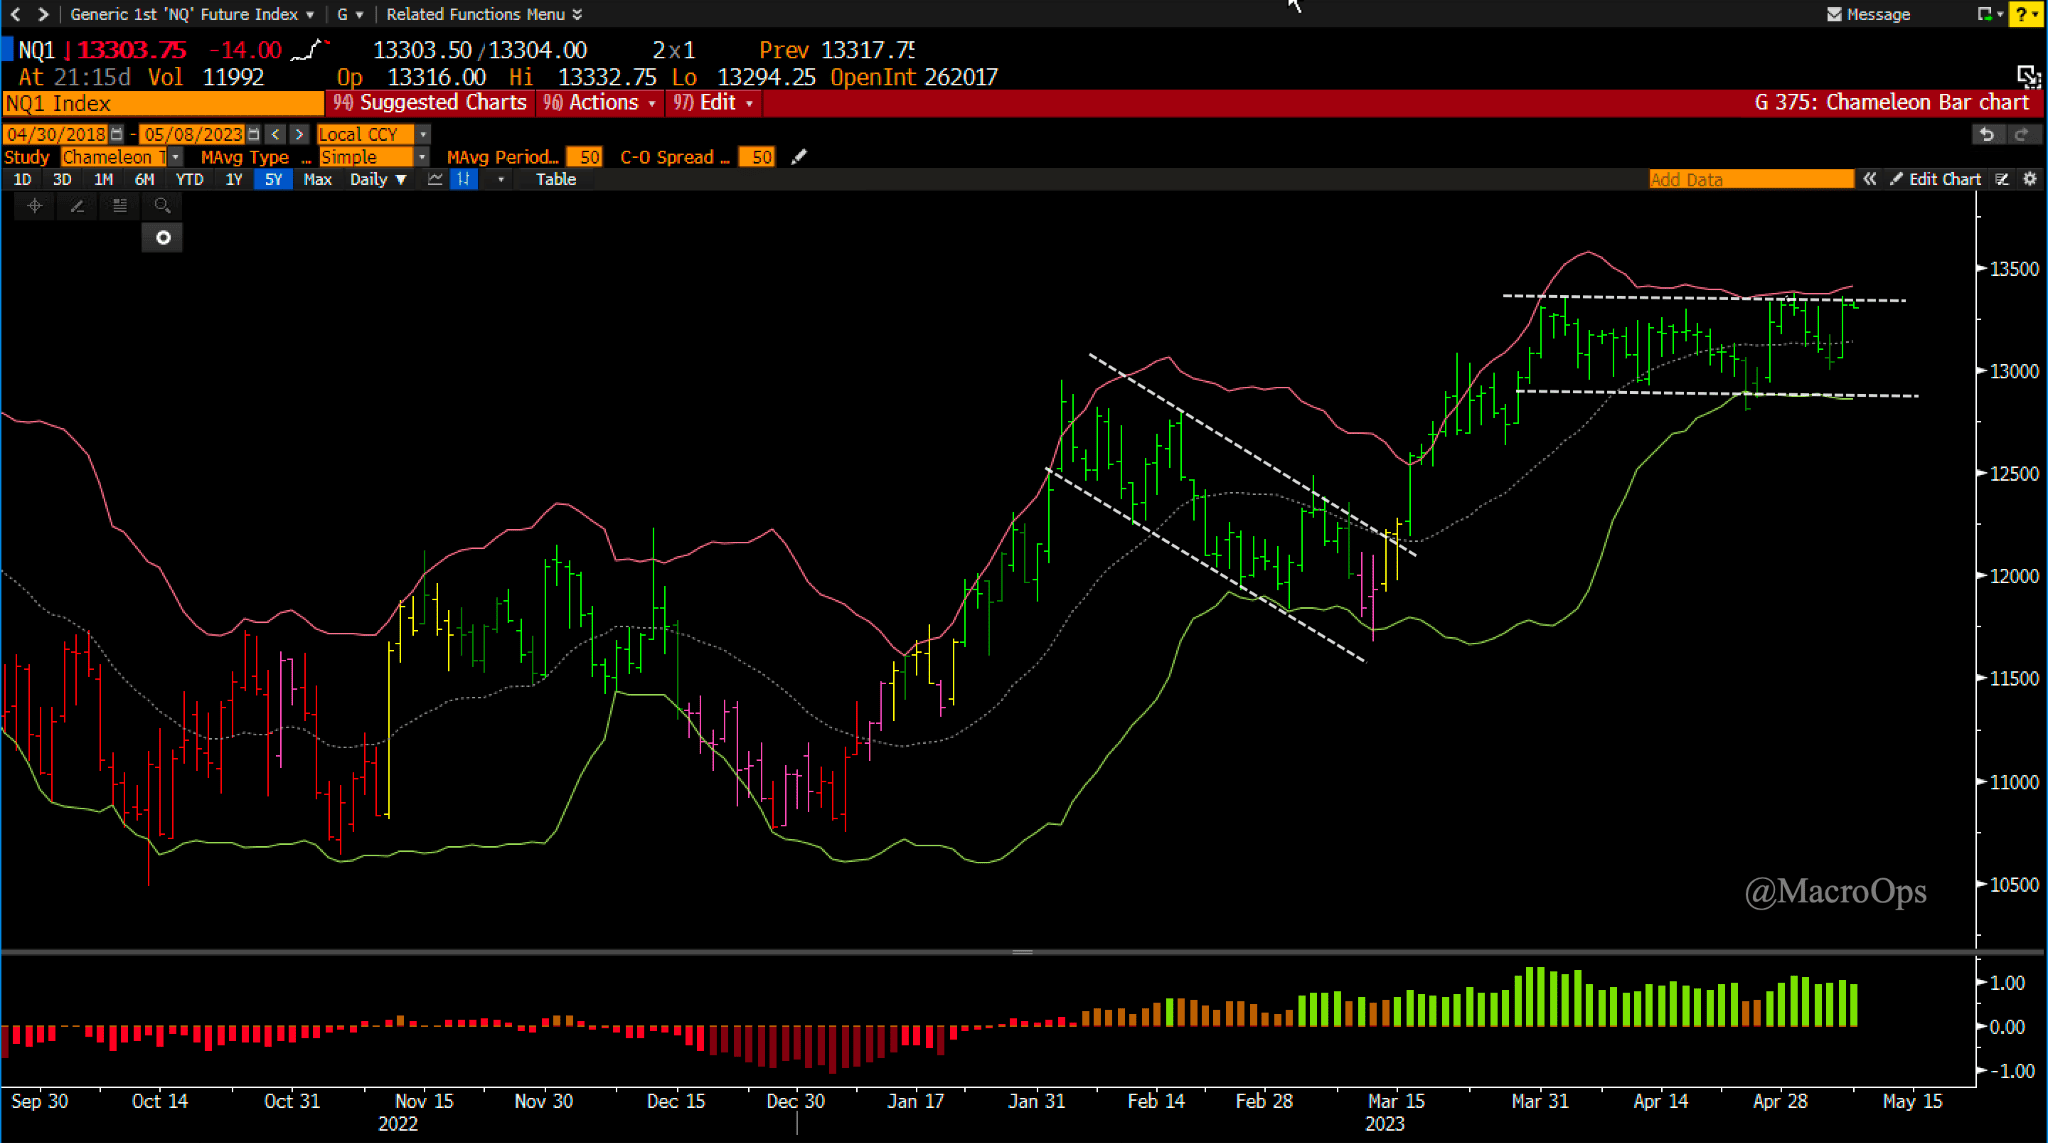
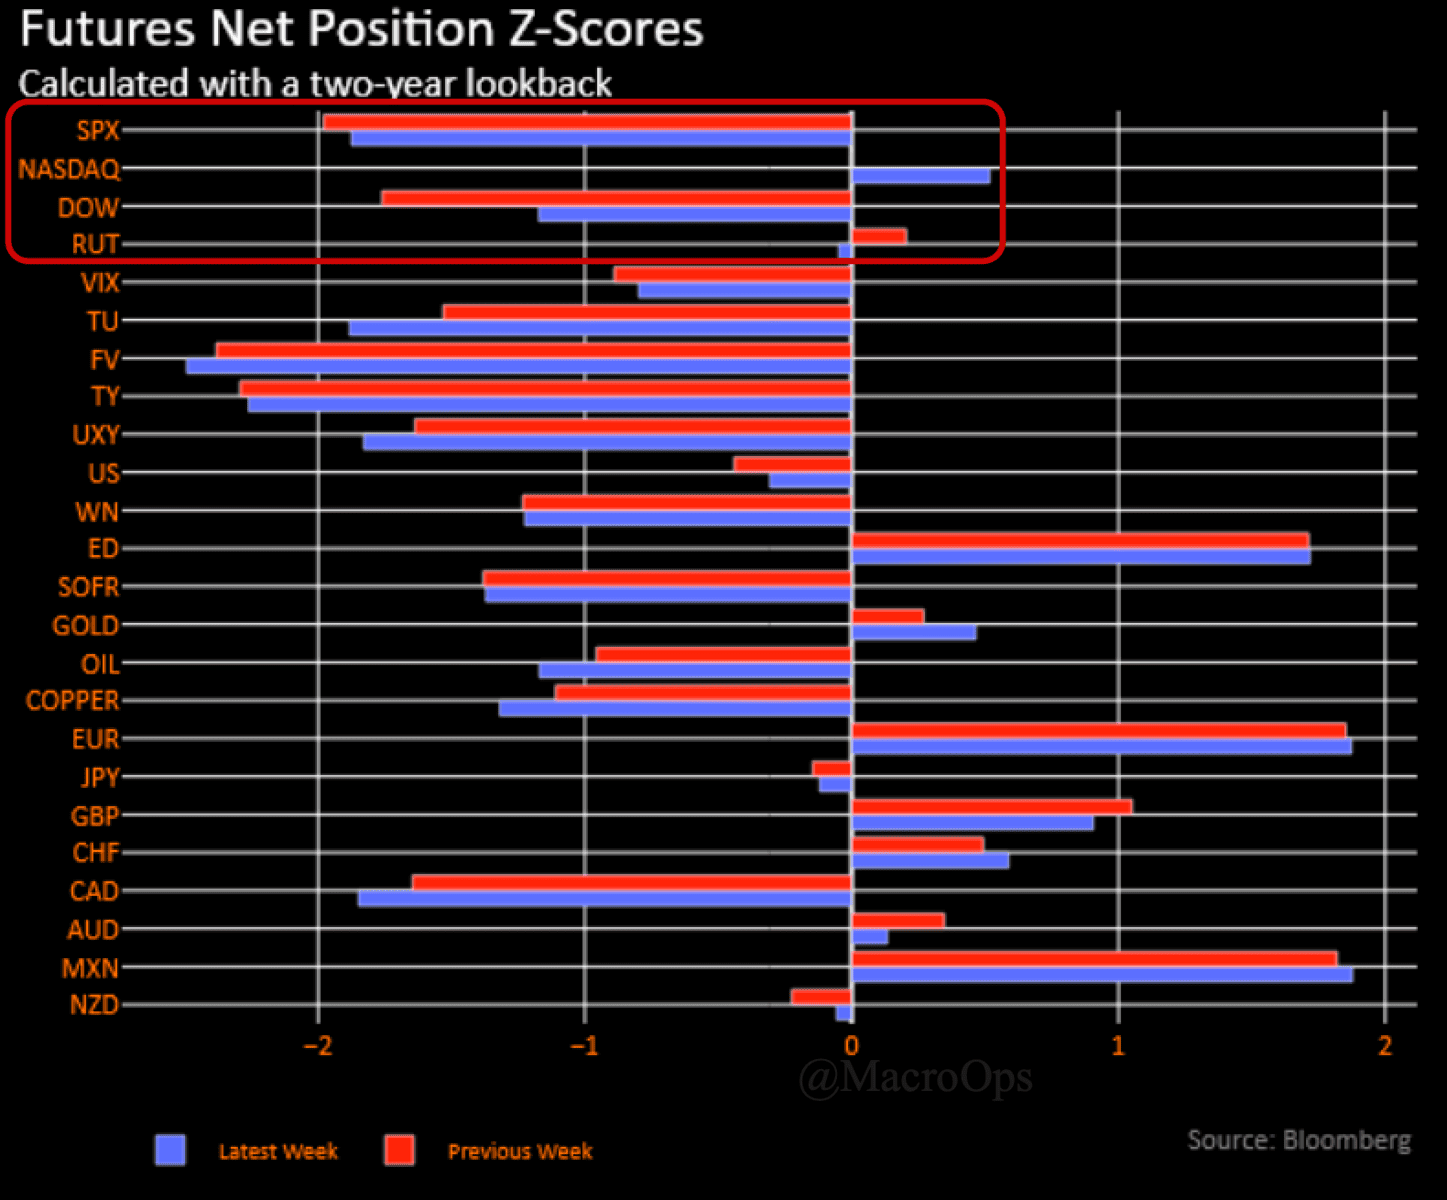
- This is especially true when CoT spec positioning in the SPX is still close to 2std bearish relative to its 2-year average (chart via BBG).
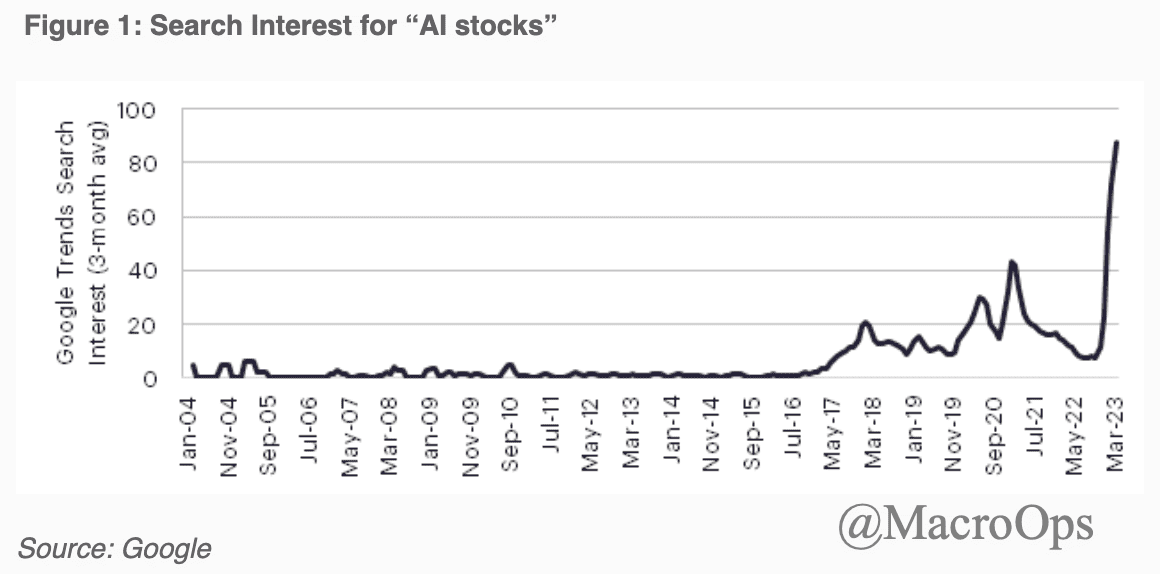
- But the narrative pendulum is starting to turn and with that speculative interest (and money) is beginning to chase into speculative names. This post by Verdad Cap looks at the historical returns for thematic baskets like “AI stocks” (hint: they’re not good).
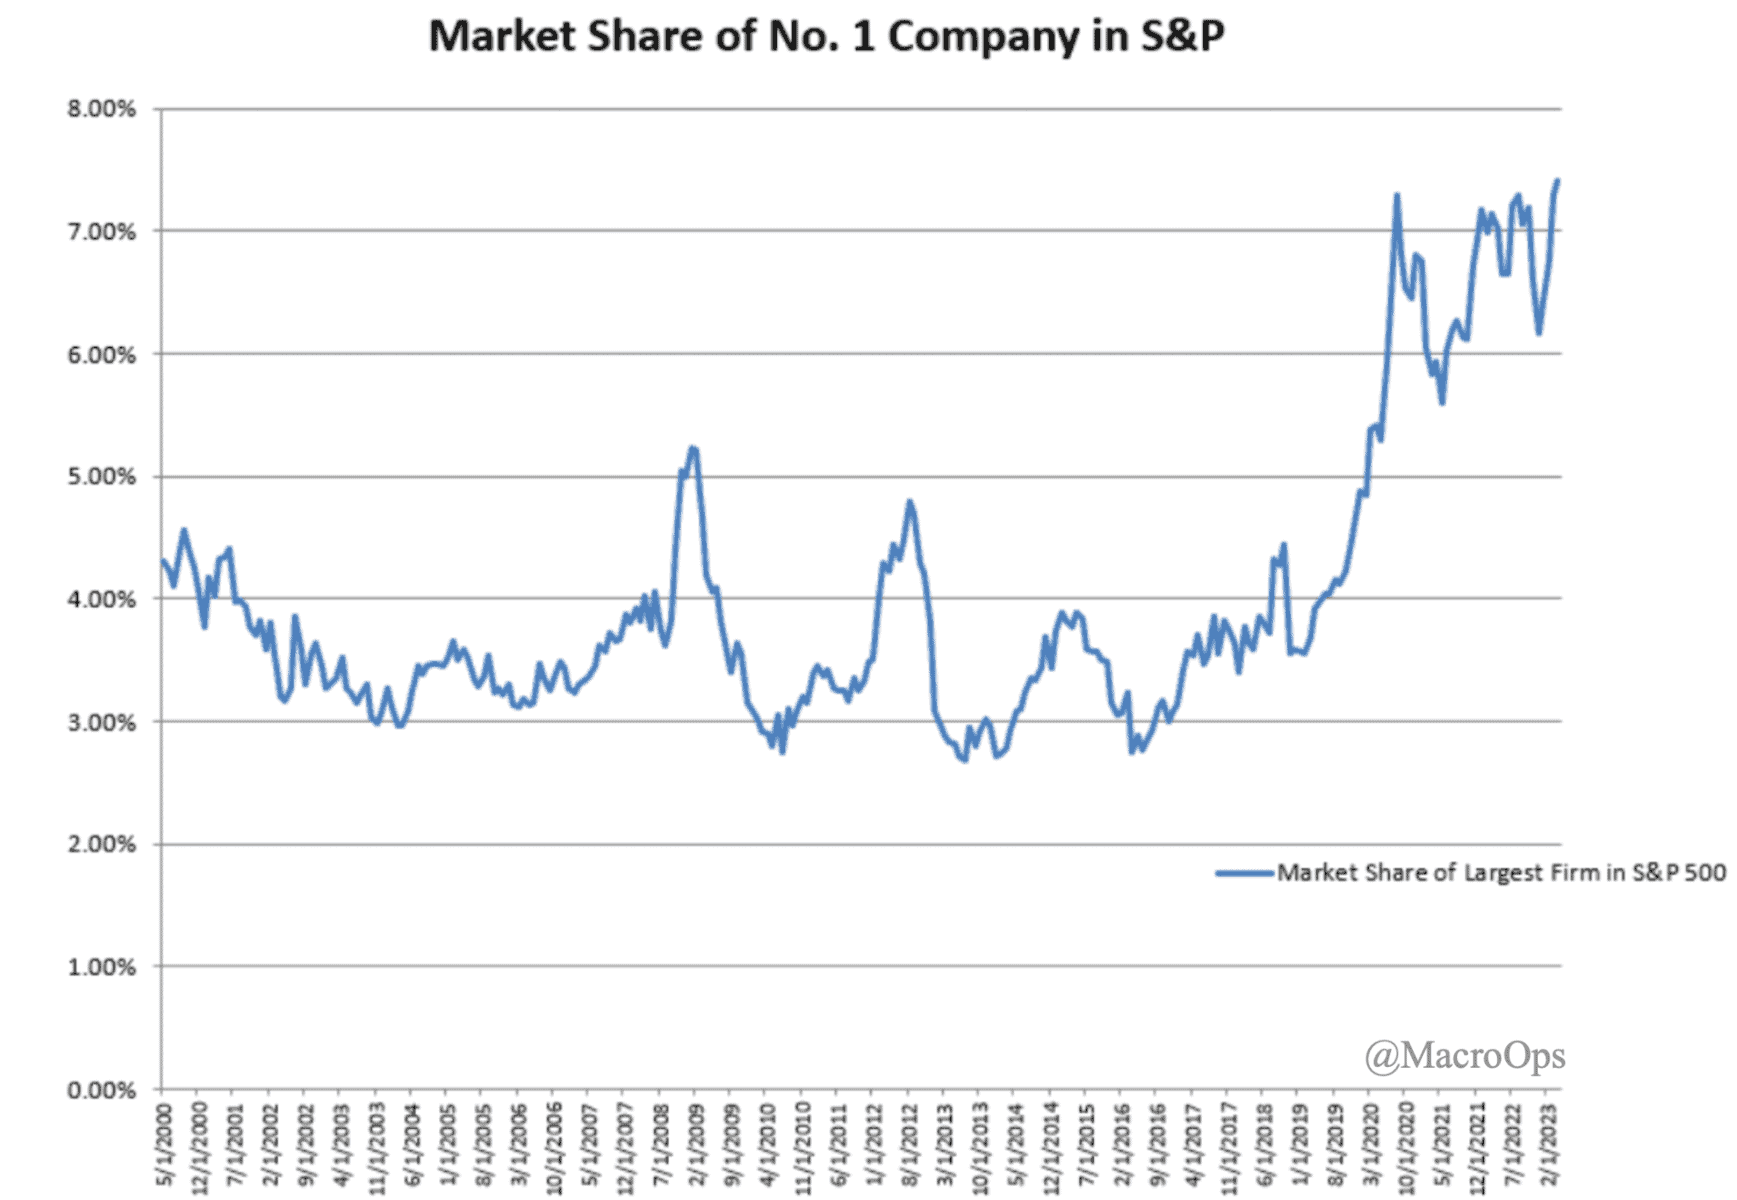
- AAPL’s market cap as a percentage of the SPX is over 7%, which I believe is a record for any company in the index’s history (chart via BBG).
It’s also trading at historically rich multiples which is a bit of a headscratcher since the $2.7trn market cap company has significant revenue and operational exposure to China, which the US is now in a cold war with.
- @SethCL shared this Cycle Composite chart for the S&P via NDR which suggests the idea of “sell in May and go away” likely doesn’t apply this year. The chart is a composite of a one-year seasonal cycle, a four-year presidential cycle, and a 10-year decennial cycle.

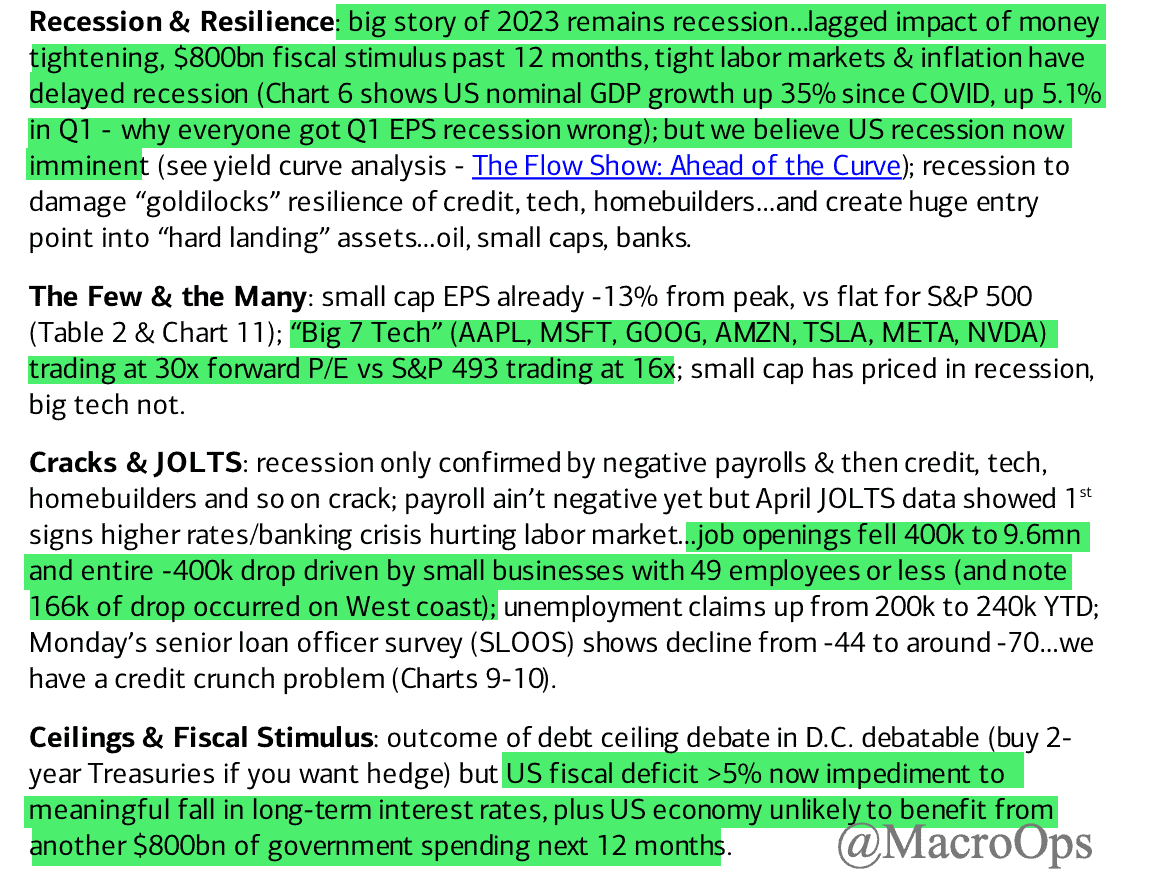
- Some key points from BofA’s Flow Show report last week with highlights by me.
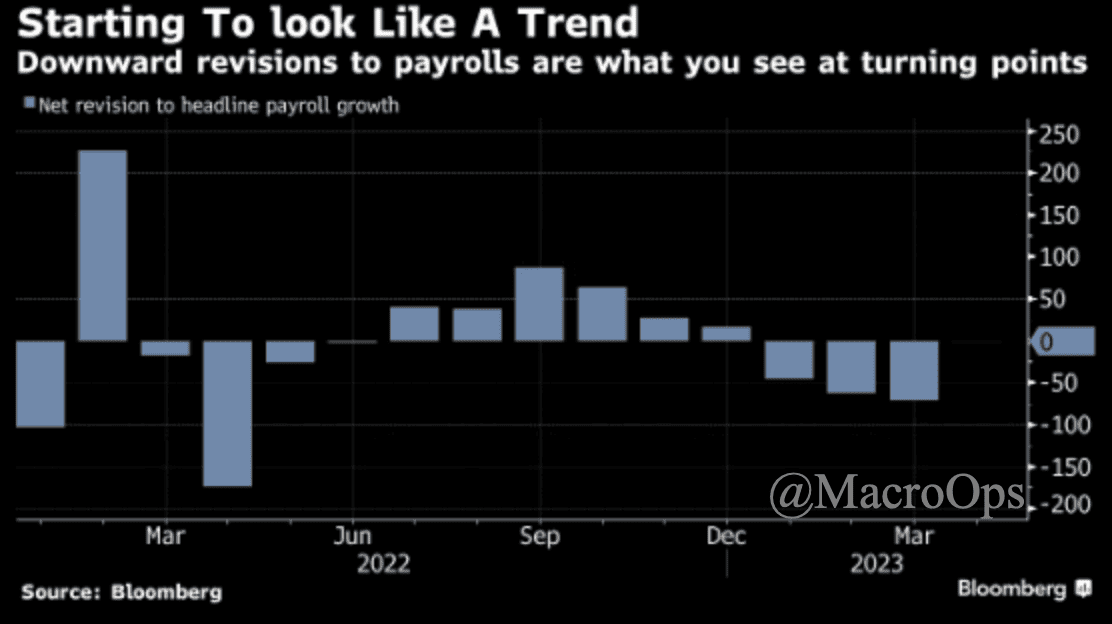
- Downward revisions to payrolls are what you see at turning points… BBG’s Cameron Crise writes that “underneath the surface, there are some signs of weakness. Past data is starting to get revised lower; net revisions for the past couple of months were -149k. That tendency is often serially-correlated, meaning that at this point in the cycle, the initial releases are over-estimating the strength of the labor market.”
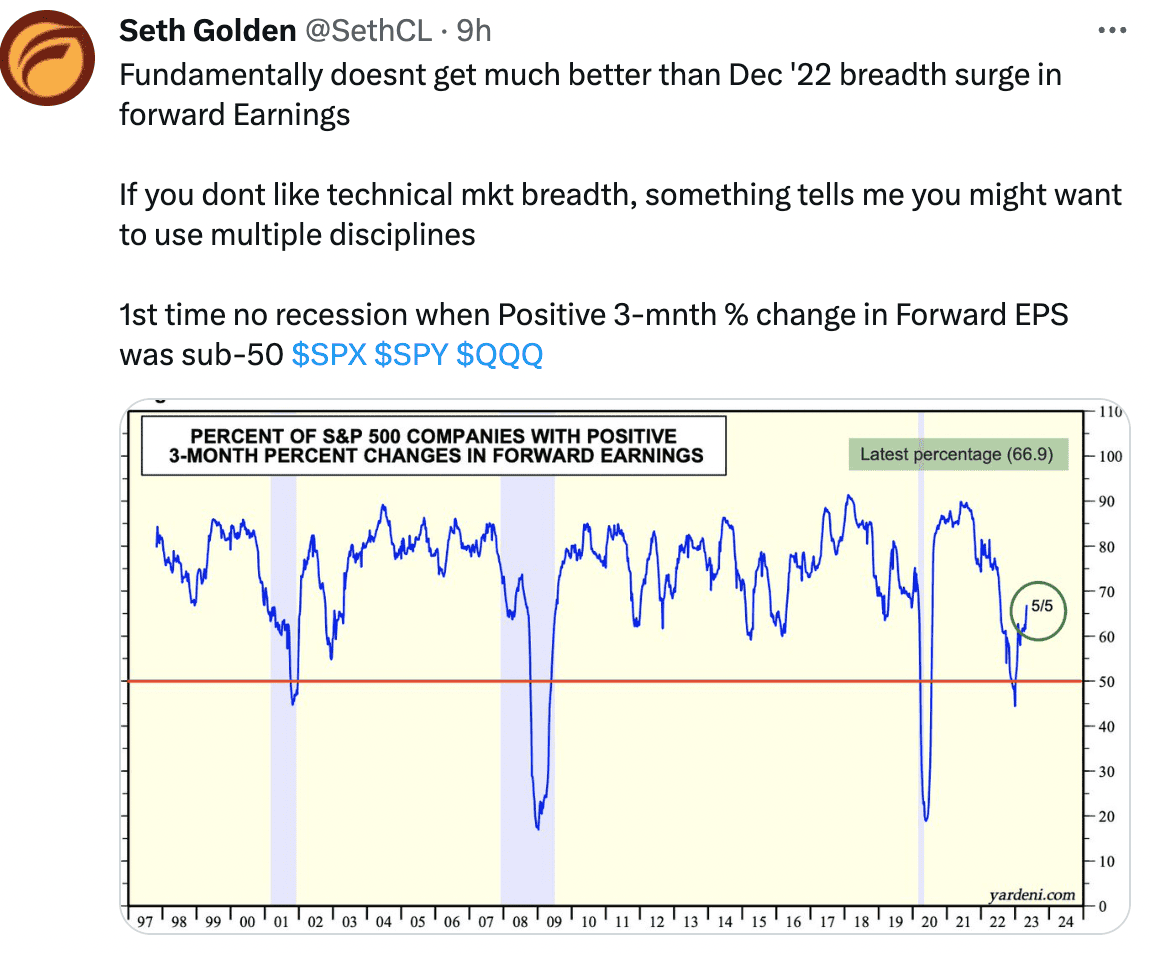
- Interesting data point from Yardeni via @SethCL. The question is do we see earnings revision breadth continue to rise from here? Our work suggests not…
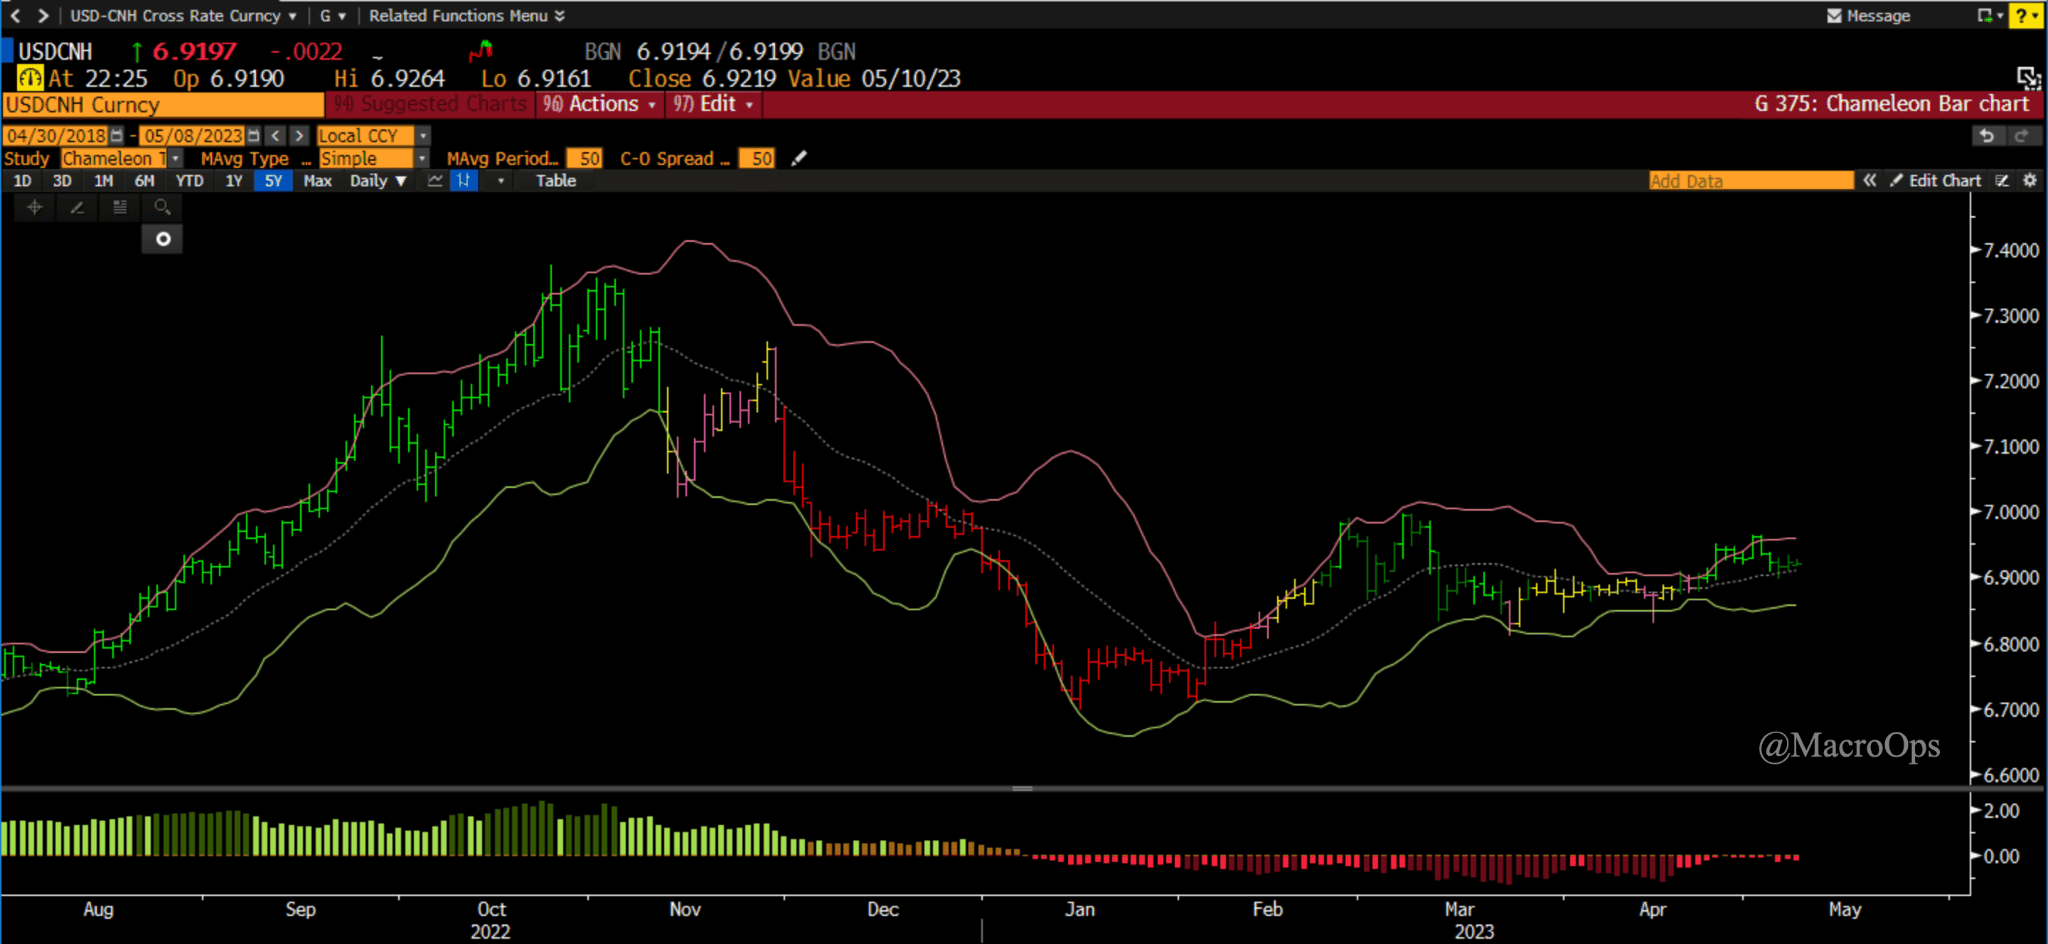
- We continue to watch and look for spots to probe USD pairs to the long side. We got knocked out of a starter in USDCNH last week but we’ll look for another opportunity to take a swing.
- Michael Kao wrote up a good post laying out the long USDCNH thesis here. Kao writes:
“The third chart on the right is key and makes me think that CNY is even closer to its Minsky Moment that I previously thought.
“Cembalest: ‘China’s money supply is very high; if China fully opened its capital account, possible outflows could crush the RMB and cause a collapse in Chinese equity/real estate markets.”

- This chart is also from that post. You can pair it with this report titled “Could China Become Like Japan In The Early 1990s?” via the The International Economy.

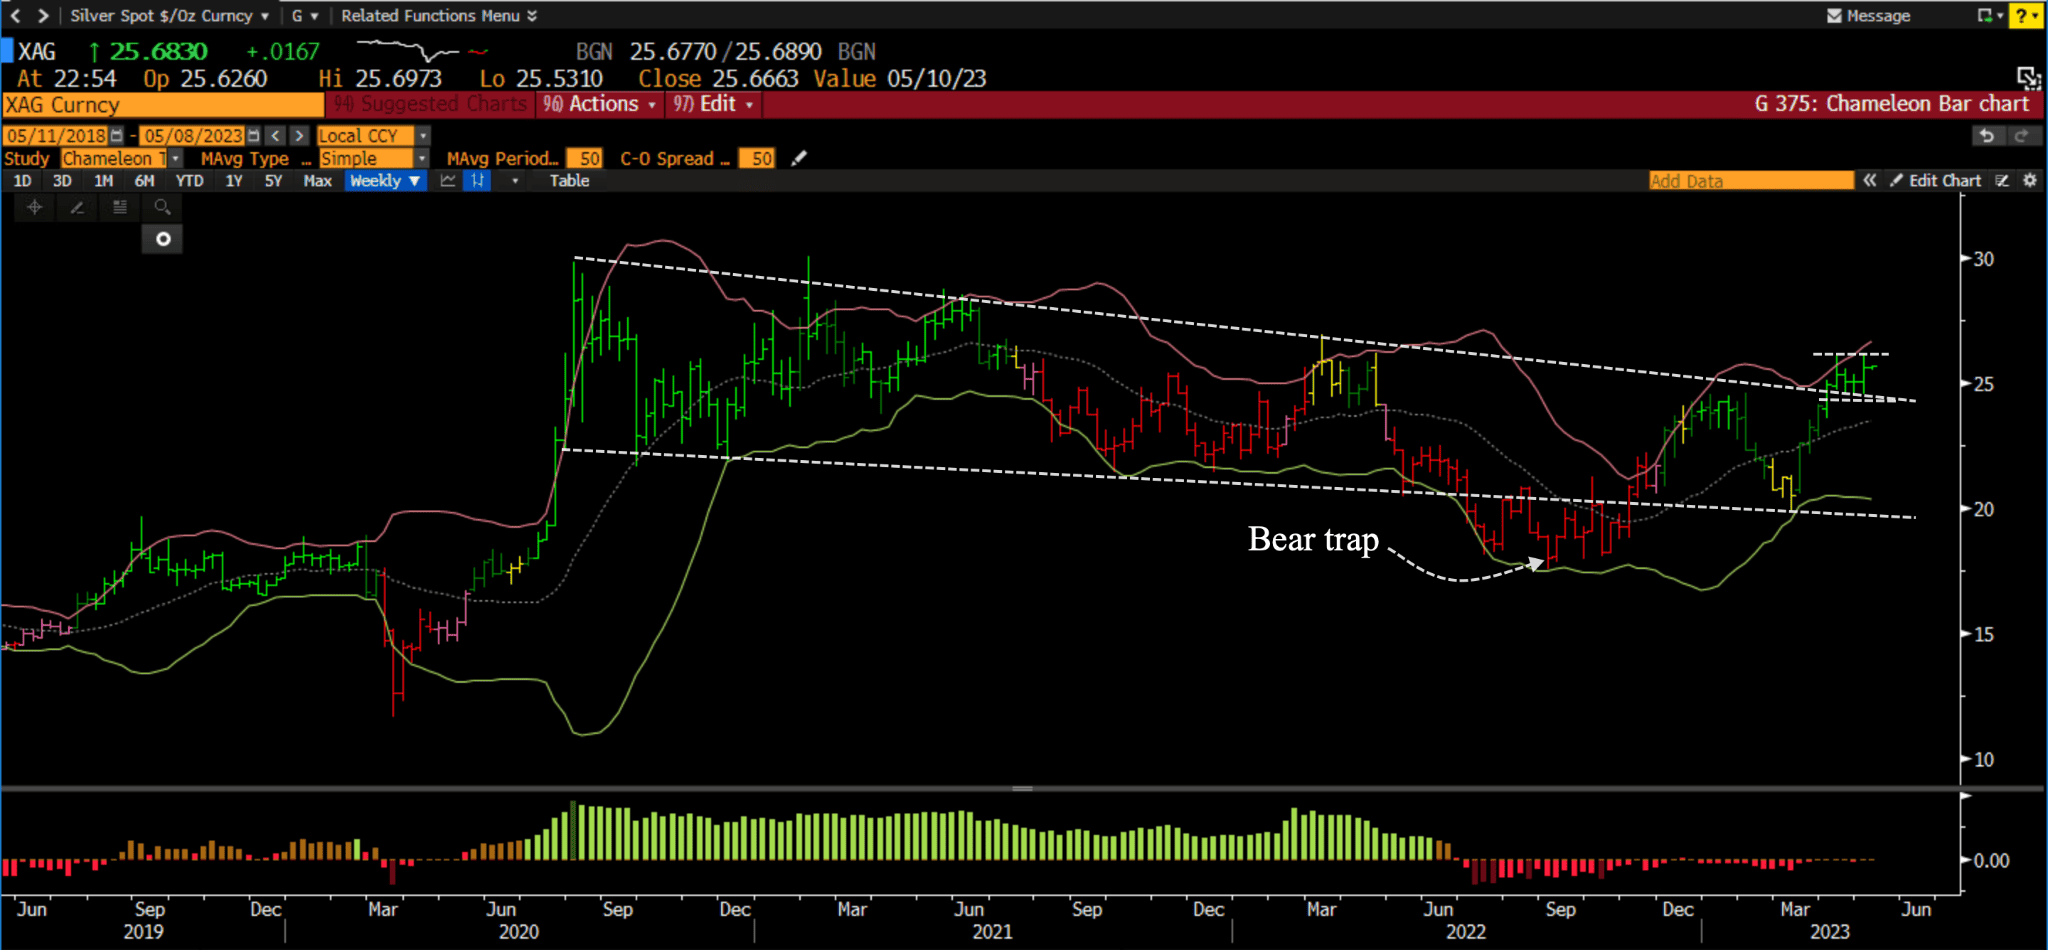
- I think bonds (TLT) continue to be the most important chart to watch in macro right now. They’re coiling tight suggesting a BIG move is coming. One of the many markets that will be directly affected by which way bonds break out is precious metals.
As of now, the long-term charts for gold and silver remain extremely constructive. The chart shown below is a silver on a weekly basis.
We’re long and will add on a breakout from its current sideways consolidation zone.
Thanks for reading.

