
Wedgewood Partners letter to client for the third quarter ended September 30, 2018; titled, “Anatomy of a Bull Market.”
H/T Dataroma
Q3 hedge fund letters, conference, scoops etc
Review and Outlook
Our Composite (net-of-fees)i increased +8.7% during the third quarter of 2018. The benchmark Russell 1000 Growth Index gained +9.2%. The S&P 500 Index gained +7.7% during the quarter.
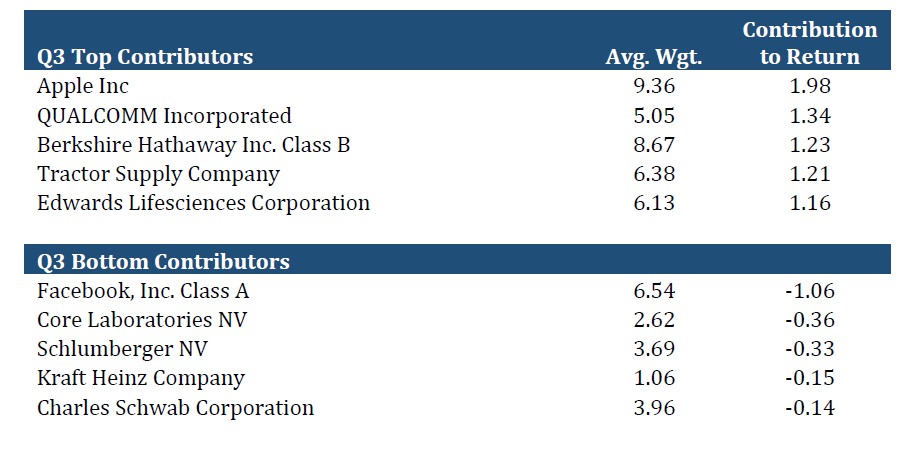
Top third quarter performance detractors include Facebook, Core Labs, Schlumberger, Kraft Heinz, and Charles Schwab. Top third quarter performance contributors include Apple, Qualcomm, Berkshire Hathaway, Tractor Supply, and Edwards Lifesciences.
During the quarter we bought C.H. Robinson, Old Dominion Freight Lines, and Ulta Beauty. We sold Kraft Heinz.
During the quarter we trimmed Core Labs, Ross Stores, and Tractor Supply. We added further to C.H. Robinson and Old Dominion Freight Lines.
On the detractor front, Facebook shares fell during the quarter after management warned about a deceleration in the rate of revenue growth and guided for margins to fall over the next several years. The Company posted 42% revenue growth for the fiscal second quarter but guided to a growth rate that seemed to be in the mid-20% for upcoming periods, with margins trending almost 10% lower over a longer-term period. We continue to overweight Facebook and maintain the position as a top holding for several reasons.
First, management has guided to decelerating revenue growth at core Facebook in nearly every quarter for the past few years, so we think there is a good amount of conservatism baked into their implicitly guided growth rates. Second, we think the revenue deceleration can be attributed to management’s proactive strategy of shifting advertisers toward under-monetized properties such as Instagram, Facebook Messenger and WhatsApp, which have less developed advertising ecosystems.
In our view, the aforementioned properties have the potential to not only stabilize growth rates but to reaccelerate as they mature with core Facebook providing a stable, high-margin cash flow stream for reinvestment. Third, management’s lower margin guide implies an incremental $6 billion or more in overhead, which we believe is more than enough capital to ensure the long-term safety and security of the platform. Last, we think the consensus embedded estimates are quite conservative, and Facebook’s fiscal 2020 price-to-earnings multiple of about 19X is very attractive, relative to our investment opportunity set, given the Company’s high absolute growth rate and excellent profitability profile.
Schlumberger and Core Laboratories stocks both fell by the same amount, despite providing different results across vastly different products and services. As Brent oil prices eclipsed $80 per barrel during the quarter –a multifold increase from 2015 lows – our energy stocks have yet to respond in kind. While we are certainly aware that energy-related equity prices tend to have a meaningful correlation with oil prices, our long-held view has been that this relationship is less fundamentally important to Schlumberger and Core Labs.
Conversely, both companies’ results are more highly correlated with the upstream capital expenditure (capex) budgets of national and international oil companies. Upstream capex spending, particularly international spending, continues to be subdued in spite of what seems to be very healthy supply and demand characteristics for the underlying commodity. As growth in international upstream budgets take longer than expected to materialize, we trimmed our positions in Core Labs, given that it was more expensive than Schlumberger on out-year budget growth. However, we continue to maintain positions in both stocks as we expect substantial pent-up demand from upstream customers, particularly at these historically attractive levels of Brent crude prices.
Qualcomm was a top contributor relative to the Russell 1000 Growth Index; after the Company reported substantial upside in their licensing business and good execution in semiconductor chipsets. In addition, Qualcomm embarked on a significant share repurchase program, which we estimate to be larger than 25% of the quarter-ending market capitalization.
We think the Company should be a long-term beneficiary of (and benefactor to) the rapidly increasing need for wireless data, not only at the consumer level, but increasingly in industrial and enterprise applications as wireless networks across the globe upgrade to bandwidth-friendly, 5G standards over the next several years.
Tractor Supply continues to execute well, reporting 10% growth in sales, with same store sales growth of 5.6% driven by both higher traffic and higher customer spending, and 35% earnings per share growth. The Company will be concluding an aggressive two-year investment ramp into technology capabilities, distribution, and stores, later this year.
We expect to reap sustainable comparable sales growth and margin expansion from those omnichannel investments over the next several years, supplemented by a steady cadence of mid-single digit square footage growth to take advantage of a growing total addressable market. As shares have appreciated meaningfully over the past 12 months, we trimmed positions but maintain a healthy overweight in Tractor Supply.
Edward Lifesciences results continue to benefit from the Company’s pioneering shift towards minimally invasive techniques and technologies for treating structural heart disease. Near-term, we think Edwards will benefit from a slate of new product launches to treat severe aortic stenosis.
Longer-term, we are becoming more confident that Edwards’ nascent, transcatheter mitral valve therapy (TMVT) portfolio has the potential to add a large and growing stream of profits to supplement current growth. Mitral valve therapy is not new, however their minimally invasive techniques – small suture-less procedures – are in their infancy. During the quarter, a competitor released important new clinical data that validated Edwards’ strategy in TMVT, but that also leaves room for the Company to offer differentiated approaches in what, we believe, could be a multibillion-dollar addressable market by the middle of the next decade.
In Berkshire Hathaway’s most recently reported quarter, underwriting profitability inflected higher at the Company’s insurance subsidiaries, particularly at GEICO, as higher pricing and a dearth of mega-cats combined to drive substantially better year-over-year results. The Company also amended their share repurchase program and removed their buy-limit of 20% premium to book value, replacing it with what Warren Buffett (CEO) or Charlie Munger (Vice Chairman) deem to be cheap enough relative to intrinsic value. No doubt the 20% premium has been an important signpost for investors for the past several years.
However, management has long signaled that they are having a hard time finding attractive investment opportunities, also evidenced in their $100 billion war-chest in low-return cash balance. If and when the cost of capital rises, either from the reversal of global quantitative easing or higher volatility, we expect Berkshire to ease up on buybacks and deploy capital at very high rates of return. Until then, and after more than 9 years of U.S. equity appreciation, we think it is prudent for management to preserve and return cash via accretive share buybacks, rather than compete with undisciplined buyers flush with cheap and easy capital.
Anatomy of a Bull Market
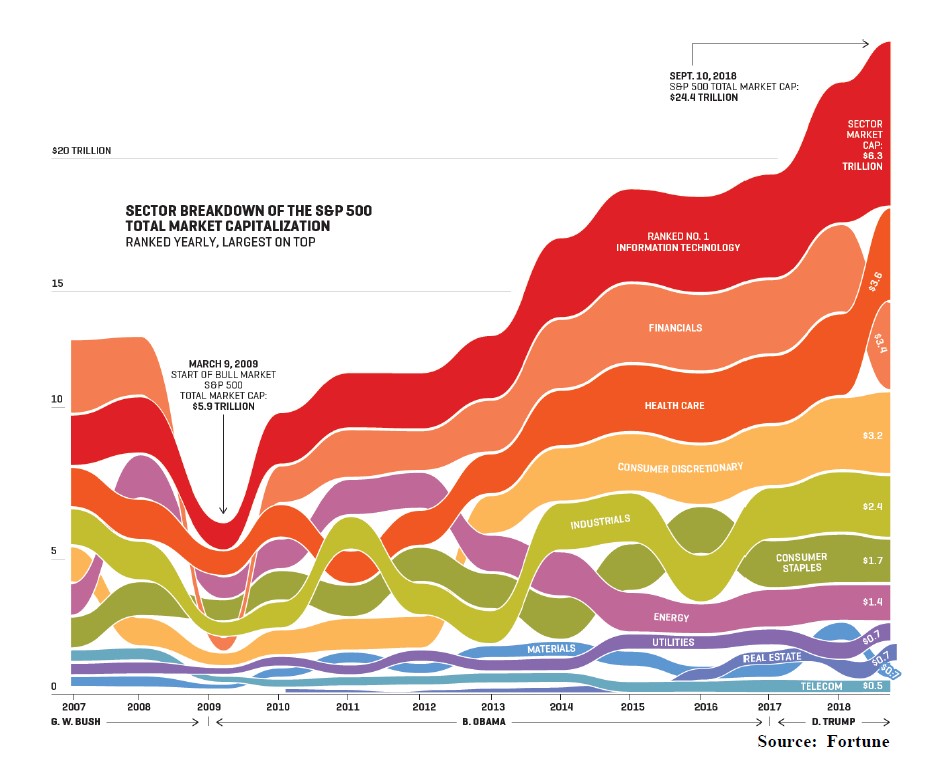
The Great Bull Market of 2009-2018 marched on to new highs during the quarter. According to Fortune, from the Great Bear Market bottom in March 2009 to now, the capitalization of companies listed in the S&P 500 index grew by more than $18 trillion. However, just three of every ten dollars in gain came from the 73 technology companies in the S&P 500. Further, the Great Bull Market over the past decade was even narrower than that, with nearly 16% of the market cap growth derived from just four stocks: Apple, Alphabet, Microsoft and Facebook. Their combined valuations soared ten-fold from just over $300 billion to more than $3 trillion (Source: Fortune).
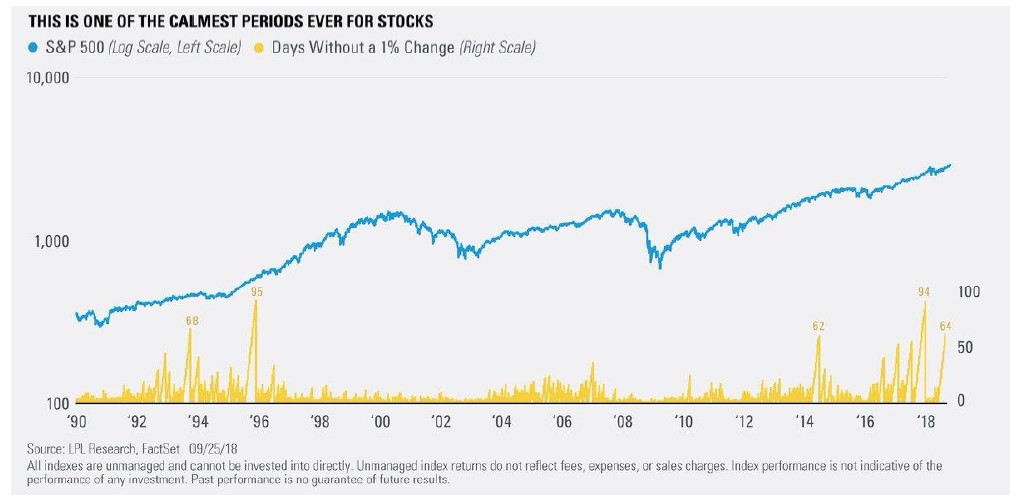
The third quarter was also historic for the lack of daily 1% moves. In addition, the lack of daily 1% volatility in the third quarter was second calmest in stock market history; the calmest was the third quarter in 1963.
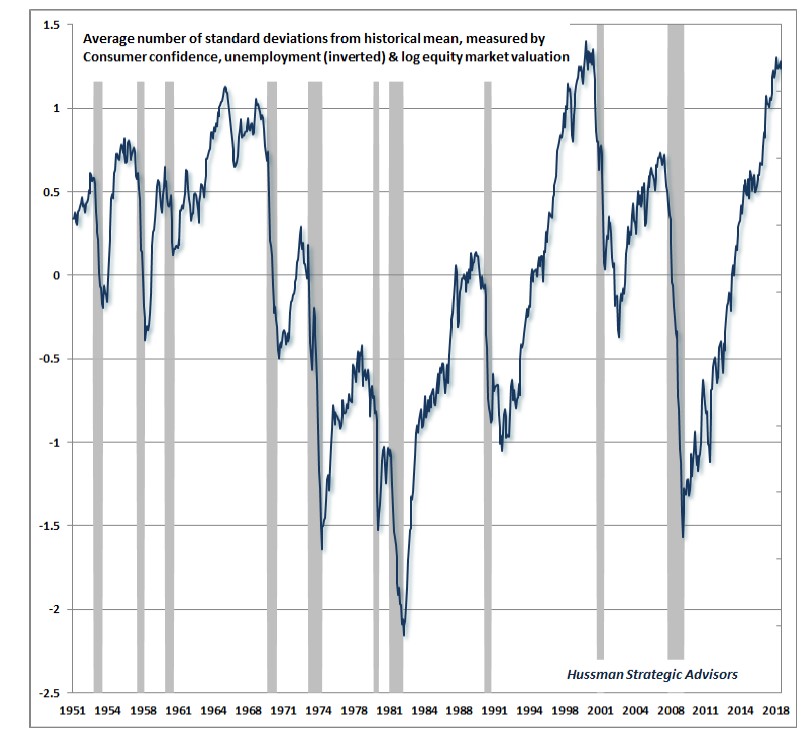
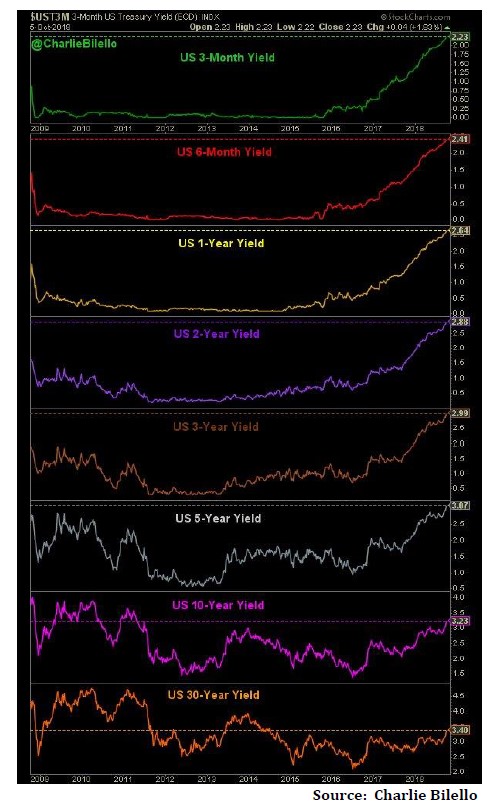
Warnings of valuation extremes from numerous camps (including Wedgewood’s) over the past year or so have failed to come to pass. Market corrections over the past half dozen years have been small and swift. Indeed, that last double-digit quarterly market decline in the S&P 500 Index was a “career” ago back in the third quarter 2011 when the S&P 500 Index had the audacity to decline -14.3%.
Such continued warnings sound like the Boy Who Cried Bear. Interest rates are on the rise. The question remains; When do higher interest rates begin to bite into stock market valuations? Nonetheless, the following table and graphics speak (shout?) to “be careful out there.”
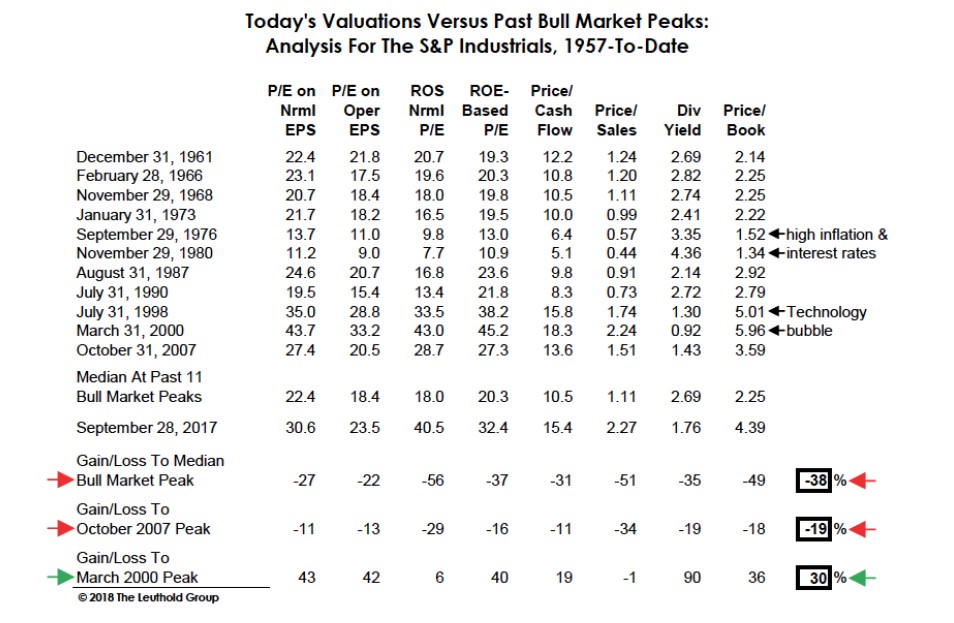
Note, the date in the middle-left in table above should read September 28, 2018 (not 2017).
Company Commentaries
Booking Holdings
Booking Holdings reported +12% growth in room-nights, +16% revenue growth and +35% adjusted EBITDA growth in their most recent quarter. While the Company’s reported room-night growth continues to decelerate, it belies strong operating performance and execution by management, with EBITDA margins expanding several hundred basis points. We understand many Booking Holdings investors are nervous about decelerating room-nights, however, we think they are missing the more important consistent improvement in overall cash flow returns, which is a byproduct of management’s excellent balance between growth and profitability. Pure top-line growth, literally at the expense of profits has been a winning strategy for many growth-oriented stocks, however we do not believe that is not sustainable without consistent outside financing (dilution), and continue to favor businesses, like Booking Holdings, that can prudently balance both.
Kraft Heinz
We sold our remaining holdings in Kraft Heinz after reducing our position last year, primarily on the elongated cadence of continued acquisitions. Our thesis for the remaining position in Kraft Heinz was reliant on the Company’s ability and tolerance for a steady cadence of inorganic growth – not unlike what we have seen at several companies where 3G Capital has a controlling stake. We expect Kraft Heinz to be an expandable platform for global brands, where the Company can acquire chronically under-earning branded consumer portfolios and implement a profit-oriented culture to drive long-term growth and value creation. While the Company can still execute this approach, we think the timeline and opportunity cost of waiting for this execution has extended and risen, respectively. We think a difficult industry backdrop has contributed to management’s trepidation for executing a deal, as well as potential targets that are less willing to cede control. As consumer brands continue to see pressure from private label and receive more pushback from an increasingly consolidated distribution channel, we believe it is inevitable that brands become more amenable to acquisition by Kraft Heinz. However, until that timeline becomes clearer, we decided to liquidate our remaining position in Kraft Heinz and allocate the proceeds to businesses that have more visible growth.
C.H. Robinson Worldwide
We purchased an initial position in C.H. Robinson in the third quarter and made a small addition to our position soon afterward. C.H. Robinson is a transportation broker whose largest business is full truckload (TL) trucking, with smaller businesses in less-than-truckload (LTL) trucking, intermodal (generally truck trailers or ocean shipping containers carried on railcars), and other forms of transportation. Robinson does not transport goods itself but provides value by matching demand from shipping customers with supply from transportation providers, or “carriers.” In Robinson’s case, those are usually small truckers who do not run sophisticated operations of their own. We had been monitoring C.H. Robinson for a period of nearly two years, as we had foreseen a long-term imbalance developing between truckload supply and demand, and we have expected Robinson to benefit eventually.
Long-haul truckers have been experiencing difficulties in recruiting drivers for many years. There are multiple reasons for this, some of them due to the changing nature of the American workforce over time. Among the most relevant factors specific to the trucking industry, we would note the unattractive lifestyle endured by long-haul drivers, who spend long hours on the road and suffer extended periods of time away from their families and homes. Furthermore, a resurgence of heavy industry in the U.S., driven especially by the emergence of the domestic energy industry, has created competition for this pool of labor, and laws preventing young workers from getting their Commercial Drivers Licenses until 21 years of age, which in turn has siphoned off many potential truckers into other trades, as high school graduates consider employment options at 18. Compounding these problems, successive regulations restricting drivers’ “hours of service” (HOS) over the past fifteen years have further reduced the driving capacity of each existing driver.
The watershed event which focused our attention upon C.H. Robinson, however, was the requirement for all trucking companies to deploy electronic logging devices (ELDs) to track drivers’ hours, which came into effect at the end of 2017. While most large truckers had been using ELDs for some time; a very significant portion of the industry, however – perhaps as much as 80% – was not. Furthermore, our research over time has revealed that trucking companies that switched from paper logging to electronic logging in the past have found that the vast majority of their truckers (in fact, we always were told “100% of them”) had been in violation of HOS rules. This effectively meant that although the HOS regulations had not changed, companies which went from self-reported paper logs to automatic electronic logs suffered an effective loss of capacity – i.e. less hours per driver – when HOS were tracked accurately with the electronic devices. Our research has suggested that this caused a significant reduction in effective U.S. truckload capacity industry-wide, basically overnight, with our best estimate being a reduction of perhaps 5%-8%. While this may not sound like much to the casual reader, we would point out that much lower reductions in capacity of 1%-2%, due to previous HOS adjustment – which, remember, were skirted by the vast majority of the industry using paper logs – had caused major disruptions as recently as 2014. We also note that trucking comprises over 80% of domestic freight volumes, meaning that any reduction in trucking capacity is a very meaningful change for the entire US economy.
In actuality, the ELD mandate has seen companies in a broad array of industries, from retailers to consumer products companies to heavy manufacturers, suddenly scrambling to find anyone with capacity to carry their goods, while finding that their shipping costs were rising dramatically when they did secure a carrier. Throughout 2018, it has been nearly impossible to listen to any quarterly earnings call with a company shipping any sort of product without hearing complaints about difficult shipping conditions. The spot market, where customers arrange for real-time, one-off shipments as needed, has been especially hard hit, with pricing running over +20% higher year-over-year for the last few quarters, at times approaching even +30%. Contract pricing – where customers will agree routes and prices, usually for an annual period – also has been very strong, in some cases reaching double-digit percentage gains. C.H. Robinson, as a transportation broker whose largest business is in long-haul trucking, would seem to be an obvious beneficiary of these market trends.
Investors noted the rising spot pricing in the truckload industry, which actually started moving a few quarters before the ELD deadline and jumped into C.H. Robinson much earlier than we had expected, and, indeed, earlier than it made much sense. Then, as the company proceeded to badly miss reported earnings for several quarters, while trucking industry fundamentals around it seemed very strong, the market suddenly became disenchanted with the company, causing its stock to take a roughly -20% hit in an otherwise surging market. This was the point when we finally became interested, because we think the market has missed a few things about this business model.
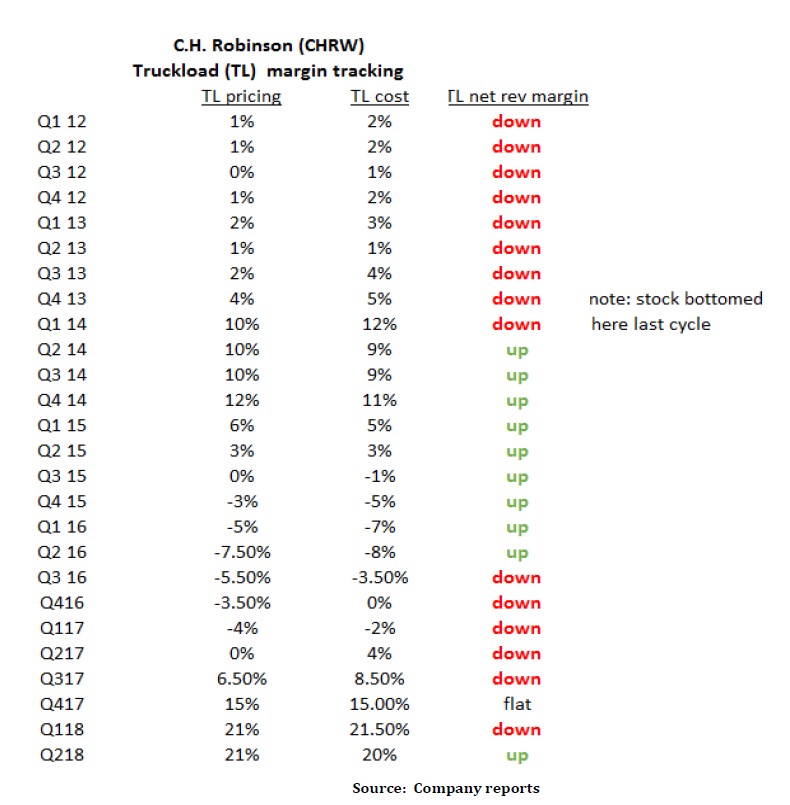
First, as we have seen in prior periods with a sudden reduction in truckload capacity, Robinson’s pricing philosophy generally sees them taking a significant margin hit for a period of time as trucking capacity tightens, plus the concomitant rise in spot pricing. Robinson favors annual contracts with their customers, while their costs (mostly spot) rise immediately, meaning there is a mismatch between rising spot pricing they are paying to trucking providers, and the contractual pricing they are receiving from their customers. This is why the company was not able to keep up with investors’ expectations as truckload fundamentals strengthened in front of the ELD deadline. We, on the other hand, had been expecting this cost/pricing mismatch, as we had experienced it in prior cycles, as illustrated below.
Second, after a great run in most stocks across the trucking industry (despite the shorter-term pullback seen for C.H. Robinson), many investors now seem to be taking their gains, with a broad narrative about the cycle being as good as it can get. We do not believe this narrative, especially as it pertains to C.H. Robinson, for two primary reasons:
- We believe the most important driver of the shortage of supply vs demand in the trucking industry is not cyclical strength (i.e. demand); we believe the most important driver of the supply/demand imbalance is secular in nature (i.e. a significant and immediate reduction in supply caused by the ELD mandate, which will take years to rebalance in any meaningful way). While rising demand definitely has played a part in the imbalance, and while economic weakness would be unhelpful, we see the industrial economy strengthening in the near term, if anything. More importantly, long-haul trucking holds the vast majority of share of U.S. transportation volumes, and we believe that only small bits of this volume can find its way to other modes of transportation, such as rail or air, without a major rethinking and overhaul of domestic supply chains. In short, we believe a supply/demand imbalance is here to stay for the foreseeable future in long-haul trucking, and this should lead to pricing strength, improving margins and returns, and sustained solid earnings growth across the industry.
- Robinson hasn’t even enjoyed the benefits of the tightening trucking market yet; in fact, has only managed to get on the right side of the cost/pricing equation in the most recent quarter, as the table above illustrates – and the benefits will begin appearing now. As annual contracts with outdated pricing roll off and are renegotiated at higher, current market pricing, Robinson finally will see margins, earnings, and cash flow growth rebounding. Furthermore, while we expect trucking providers to continue to enjoy rising pricing power, we expect pricing to rise at a lesser rate, meaning that Robinson most likely will enjoy a period during which the pricing they are charging to customers will be rising at a significantly greater rate than the pricing they are paying to their trucking providers.
With valuation sitting only at roughly average historical levels, in comparison to the broad market trading at elevated historical levels, and with company fundamentals only inflecting positively just now and looking to remain healthy for the foreseeable future, we view C.H. Robinson is an attractive home for our clients’ capital.
Old Dominion Freight Line
Old Dominion Freight Line has been a family run business for decades. Old Dominion was founded in 1934 in Richmond, Virginia by Earl and Lillian Congdon, running a single truck between Richmond and Norfolk. The founding year was fortuitous as the U.S. economy was in the early innings of its slow recovery from the Great Depression. During the first half of the 1940s, in combination new congressional industry regulations, and World War II armament spending, the trucking industry boomed. In the early 1950s, Earl Sr. passed, and his wife Lillian ran the Company with sons Earl, Jr. and Jack. In 1962 Earl, Jr. became President. In 1962 the Company moved to High Point, NC. The Company went public in 1991. In 1998, David Congdon (grandson of Company founders) is named President and Chief Operating Officer. In March 2018, Greg Gantt, a 24-year Company veteran was named President and COO while David Congdon becomes Vice Chairman of the Board and CEO.
In the ensuing decades, organic market expansion was complemented by acquisitions of Bottoms-Fiske Truck Line (1957), Barnes truck Line, Nilsson Motor Express and White Transport (1969), Star Transport (1972), Deaton Trucking (1979) and Carter and Sons Trucking (2001). Since 2006, trucking and transport assets were purchased from Wichita Southeast Kansas Transit, Priority Freight Line, Bullocks Express Transportation, and Bob’s Pickup.
In the early 1980’s Congress partially deregulates the motor carriers, granting nationwide operating authority to all applicants. The Company extending their services to Florida, Tennessee, California, Dallas and Chicago, with particular focus on less than truckload shipping.
Trucking companies provide transportation services to virtually every industry operating in the United States and generally offer higher levels of reliability and faster transit times than other surface transportation options. The trucking industry is comprised principally of two types of motor carriers: LTL and truckload.
LTL is used for the transportation of small freight or when freight doesn’t require the use of an entire trailer. This shipping method can be used when freight weighs between 150 and 15,000 pounds. When shipping LTL, the shipper pays for the portion of a standard truck trailer their freight occupies, while other shippers and their shipments fill the remaining space.
LTL freight carriers typically pick up multiple shipments from multiple customers on a single truck. The LTL freight is then routed through a network of service centers where the freight may be transferred to other trucks with similar destinations. LTL motor carriers generally require a more expansive network of local pickup and delivery (P&D) service centers, as well as larger breakbulk, or hub, facilities. E-commerce continues to be a significant tailwind for LTL shippers.
In contrast, truckload carriers generally dedicate an entire truck to one customer from origin to destination. Significant capital is required to create and maintain a network of service centers and a fleet of tractors and trailers. The high fixed costs and capital spending requirements for LTL motor carriers make it difficult for new start-up or small operators to effectively compete with established carriers. In addition, successful LTL motor carriers generally employ, and regularly update, a high level of technology-based systems and processes that provide information to customers and help reduce operating costs.
The main advantage to using an LTL shipper is that shipments can be transported for a fraction of the cost of hiring an entire truck and trailer for an exclusive shipment. In addition, LTL drivers are typically paid on a per-stop basis and generally drive the same route for long periods with the added benefit that better drivers establish rapport with customers. Over the past several years, the growth of the U.S. LTL industry has outstripped the overall U.S. trucking industry and transportation industry, in part due to a secular shift towards shorter supply chains, partially driven by the logistical requirements of a larger, fast growing e-commerce industry. Old Dominion has grown faster than the LTL market, and continues to expand its profitability, relative to competitors, due to their differentiated approach, which we think is sustainable.
According to the Company, more than 97% of the Company’s revenue has historically been derived from transporting LTL shipments for their customers, whose demand for their services is generally tied to industrial production and the overall health of the U.S. domestic economy. The Company is currently the third largest LTL motor carrier in the United States, as measured by 2017 revenue with 10% of the LTL market.
The growth in demand for the Company’s services can be attributed to their ability to consistently provide a superior level of customer service at a fair price, which allows customers to meet their supply chain needs. Integrated structure provides customers with consistently high-quality service from origin to destination, and operating structure and proprietary information systems enable efficient management of operating costs.
As of December 31, 2017, the Company reports that they operate 228 service center locations, of which they owned 194 and leased 34. Their network includes ten major breakbulk facilities located in Rialto, CA; Atlanta, GA; Columbus, OH; Indianapolis, IN; Greensboro, NC; Harrisburg, PA; Memphis and Morristown, TN; Dallas, TX; and Salt Lake City, UT. Service centers are strategically located throughout the country to provide the highest quality service and minimize freight rehandling costs.
Service centers are responsible for the pickup and delivery of freight within their local service areas. Each night, service centers load outbound freight for transport to their other service centers for delivery. All inbound freight received by the service center in the evening or during the night is generally scheduled for local delivery the next business day, unless a customer requests a different delivery schedule.
According to the Company, as of December 31, 2017, the Company owned 8,316 tractors. They generally use new tractors in linehaul operations (movement of cargo between two major cities or ports, especially those more than 1,000 miles apart) for approximately three to five years and then transfer those tractors to P&D operations for the remainder of their useful lives. In many service centers, tractors perform P&D functions during the day and linehaul functions at night to maximize tractor utilization. The Company employed 19,183 individuals full-time, none of whom were represented under a collective bargaining agreement. Full-time employees work in the following roles: Drivers 10,187, Platform 3,443, Fleet technicians 557, Sales, administrative and other 4,996. Total: 19,183. The Company employed 5,311 linehaul drivers and 4,876 P&D drivers full-time. They select drivers primarily based on safe driving records and experience.
Since 1988, the Company has provided the opportunity for qualified employees to become drivers through the “Old Dominion Driver Training Program.” There are currently 2,892 active drivers who have successfully completed this training, which was approximately 28.4% of the driver workforce as of December 31, 2017. Their driver training and qualification programs have been important factors in improving their safety record and retaining qualified drivers.
Annual turnover rate for driver graduates is approximately 5.9%, which is below the Company-wide turnover rate for all drivers of approximately 8.0%. Drivers who maintain safe driving records receive annual bonuses of up to $3,000 per driver.
Revenue is generated primarily from customers throughout the United States and other parts of North America with 60% industrial and 25% retail and 15% residential. In 2017, the largest customer accounted for approximately 3.7% of revenue and the largest 5, 10 and 20 customers accounted for 11.2%, 17.0%, and 23.6% of revenue, respectively. For each of the previous three years, more than 95% of revenue was derived from services performed in the United States and less than 5% of revenue was generated from services performed internationally.
The Company’s long-held strategy is to grow capacity and build terminal density to ultimately get closer to their customers. Old Dominion’s competitive advantage is their industry-leading LTL hub and spoke network capacity, which insures 99% on-time delivery on 1 and 2-day deliveries. Proof of their competitive advantage is their consistent +600 bps operating margin advantage relative to their competitors.
Annual network capex expenditures are also a Company competitive advantage to ensure industry-leading customer satisfaction. In 2018 capex should reach $555 million – $310 for tractors and trailers and $200 million in real estate and service center expansion. 2017 capex was $382 million. The Company opened 10 and 22 new service centers over the past five and ten years, respectively, for a total of 228 service centers as of December 31, 2017.
Several of Old Dominion’s larger competitors have shrunk their service terminal networks or outsourced shipping capacity to third parties during the past decade, meanwhile Old Dominion has continued to expand its network of service centers, and owned-and-operated linehaul and P&D tractors. As a result of Old Dominion’s consistent, long-term strategy to reinvest in capacity, the Company has substantially less reliance on purchased (third party contracted) transportation capacity, just as the trucking industry finds itself staring down a long road of labor shortages. Historically, Old Dominion has had a low single-digit percent of revenues serviced by third party capacity, and a few years ago moved even further away from this reliance. A limited reliance on purchased transportation allows management to focus on maximizing the profitability of Old Dominion’s existing capacity, while prudently reinvesting in incremental capacity. We think the Company’s focus of driving returns on owned-capacity is a superior long-term strategy, compared to chasing market share, especially against the backdrop of a domestic trucking industry facing chronic capacity shortages.
We expect Old Dominion revenues to continue benefitting from the long-term shift towards LTL mode of shipping. Despite continued reinvestment in capacity to meet demand, we expect industry leading operating ratios to continue, and help drive an attractive long-term, double-digit growth profile for the Company.
Earnings per share in 2017 were $5.63. 2018 and 2019 earnings expectations are $6.45 and $7.25, respectively.
Ulta Beauty
We initiated a position in Ulta Beauty during the quarter. Ulta is one of the largest beauty retailers in the U.S., typically located in off-mall spaces. For several quarters, the company reported comparable store sales numbers that seemed to defy the general retail space and at the same time seemed unsustainable over the long term. The Company was growing much stronger than peers in both top line sales and bottom-line earnings, with the former running at a strong double-digit rate. Valuation levels of Ulta started to come in around mid-2017 as comps were beginning to slow from the peak mid-teens. However, the Company continued to put up strong sales growth and management was sticking to their +20% earnings growth target through 2018. Current comparable store sales are running in the high single-digits, still much better than their peer group. Ulta is expanding their digital footprint and investing in their e-commerce business, which has now risen to 10% of total company sales (a year ahead of target), allowing them to compete and grow in the all-important online space.
Ulta has a small share of the $138 billion market for beauty products and services in the U.S. While this market has seen steady growth of low single-digits in mass cosmetics and mid-to-high single-digits in the prestige beauty space, Ulta is reporting bottom line growth in the 20% range, which means they are gradually capturing market share from their peers. Their store growth model currently targets 1,400 to 1,700 stores over the next several years, which would result in store base growth in the high single-digit to low double-digit range as they open approximately 100 stores on average per year. Having ended the most recent quarter with just over 1100 stores, this leaves years to their store growth model alone.
The company’s target customer is the “beauty enthusiast,” a segment of shoppers that is the most engaged in the category with high expectations for their shopping experience. They represent 57% of women and 77% of spend in the category, crossing all aspects of demographics, age, race, and ethnicity. Ulta believes their share of beauty enthusiasts is 30%, which leaves plenty of room to capture a larger share of this group. Ulta also has a loyalty program which consists of nearly 30 million members as of the end of the most recently reported quarter. The program has shown strong member retention and 90% of total company sales come from loyalty members. These members tend to shop more frequently as well as spend more than nonmembers. Ulta, in addition, is working to increase shopper engagement. Only 10% of loyalty members are shopping both online and in store. As Ulta converts these shoppers to a more omni-channel guest, they have found that their transaction spend increases dramatically – nearly 3X.
The purchase of Ulta brought the third retail name into the portfolio, but business-model overlap between the trio is de minimis. Ross Stores has limited health and beauty offerings and of course dominates the off-price apparel space. Tractor Supply caters to the niche rural lifestyle. And as we have done with the two other retail names (and really every holding in the portfolio), we also determined Amazon’s threat to the Ulta model. The perceived risk is that Amazon will crush all existing brick-and-mortar retail stores. However, we are seeing digitally native brands partner with Ulta to enhance their distribution through brick-and-mortar offerings (e.g. Colourpop, Morphe, and the most recently announced partnership with Kylie Cosmetics). In addition, Amazon health and beauty offerings tend to be more health and wellness replenishment items. Individuals are not likely to experiment with new brands without being able to test color, formula, etc., and this is where we believe the brick-and-mortar store offers a clear advantage to an online only offering.
For these reasons, we believe Ulta provides a well-diversified addition to the portfolio with plenty of room for growth, which we were able to add at reasonable valuation relative to historical figures.
Addendum
We wrote in the previous Letter that due to the strength in the technology stock prices over the last few quarters, Wedgewood’s overall sector exposure to information technology had temporarily increased higher than our usual 35%-40% sector guidelines and was approximately 41% for the Composite at the end of the second quarter. Since then, the Global Industry Classification Standard (GICS®) telecommunication services sector was broadened and renamed “Communication Services” and now includes some previously-categorized information technology and consumer discretionary companies. This reclassified Facebook and Alphabet into that new sector and therefore, our sector percentage dropped dramatically with the reclassification. We are now back within the normal guidelines and the Composite’s information technology sector weighting was 29% at the end of the quarter.
We wish to once again thank those clients who have been steadfast in support of Wedgewood Partners.
October 2018
David A. Rolfe, CFA
Chief Investment Officer
Michael X. Quigley, CFA
Senior Portfolio Manager
Morgan L. Koenig, CFA
Portfolio Manager
Christopher T. Jersan, CFA
Research Analyst

