
FORECASTS & TRENDS E-LETTER
by Gary D. Halbert
December 18, 2018
IN THIS ISSUE:
1. The Normal Yield Curve & An Inverted Yield Curve
2. Why Is An Inverted Yield Curve So Important?
3. As Usual, The Fed is the Wild Card in All of This
4. Trump’s Tariff Rhetoric is Greater Market Threat
Q3 hedge fund letters, conference, scoops etc
Overview
The US economy is booming with GDP growth of 4.2% and 3.5% (annual rates) in the 2Q and 3Q. Consumer confidence has soared over the last decade to near the highest level ever recorded. Corporate profits have exploded this year, thanks in part to Trump’s tax cuts. The unemployment rate has plunged to the lowest in decades at 3.7%.
Yet US stocks, which have soared to record high after record high in recent years, have plummeted in recent weeks. The question is, what is going on? We hear that stocks have sold off for two primary reasons: growing fears about a trade war with China and a yield curve inversion which many believe means a recession just ahead.
President Trump continues to threaten China with more tariffs, but I hope he is he is smart enough to avoid a full-blown trade war with China. We’ll see. On the yield curve front, I’ll tell you why fears of the inverted yield curve are overblown, in my opinion.
Let’s get right to it.
The Normal Yield Curve & An Inverted Yield Curve
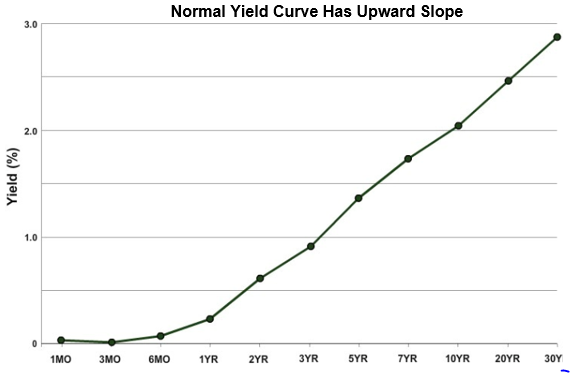
Most of my clients and readers understand what the yield curve is. The yield curve is the level of borrowing rates (interest rates) at various maturities. Normally, interest rates rise with the length of borrowing maturities. This makes sense since you would normally require a higher interest rate for a longer borrowing time.
Put differently, if you are a lender, you would require a higher interest rate on a loan with a 10-year maturity than you would for a loan with a 2-year maturity. Ditto for a loan with a 30-year maturity, such as a mortgage, versus a loan with a 10-year maturity. So, the normal yield curve has an upward slope, such as you see below.
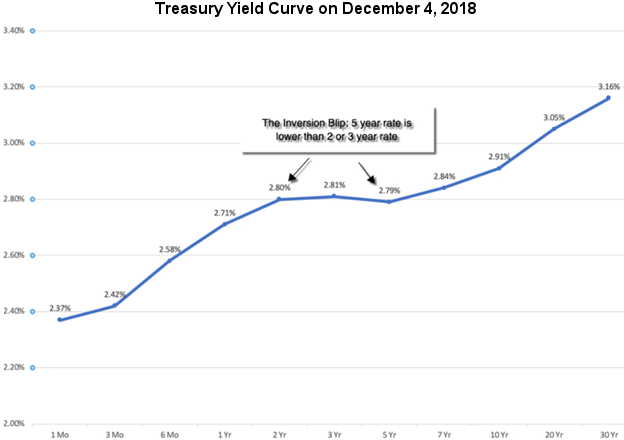
Yet in recent weeks, a part of the yield curve has “inverted,” meaning a section of the curve has shorter-term rates rising above longer-term rates, as you can see below. The yields on the 2-year and 3-year Treasury Notes have risen marginally above the yield on the 5-year Treasury Note, which by definition is an inverted yield curve.

There is a lot of history behind inverted yield curves, which I will get to below, but before I do, let me point out that the current inverted yield curve is very minimal and only applies to a very short period on the overall yield curve. As you can see above, the inverted yield curve applies only to the 2-3-year segment of the curve versus the 5-year time-frame.
Notice also that the overall yield curve is still very much upward sloping. Not only is the partial inverted section limited to the 2-year/5-year period, the degree to which it is inverted is very minor (2.80% vs 2.79%).
Keep in mind that historically yield curve inversions were measured by the spread between the 2-year Treasury (or something even shorter) and the 10-year Treasury yield, which as of the end of last week stood at 2.70% versus 2.90%, which is nowhere near inverted.
Side Note: It never ceases to amaze me how analysts will focus on certain micro-aspects of the markets such as the above in their attempts to explain price behavior like the latest sharp selloff in stocks.
Why Is An Inverted Yield Curve So Important?
As I hope I have made clear just above, I don’t believe we are in a significant inverted yield curve environment right now. Only a small section of the yield curve is currently inverted, and the overall curve is still pointedly upward sloping.
Yet if we are headed into a more overtly inverted yield curve environment, which I don’t currently expect, there are some significant implications. The most important of which is that inverted yield curves have preceded the last seven recessions.
Let me show you with a chart dating back to 1980. As you’ll see below, the last five recessions since 1980 have been preceded by an inverted yield curve. But as you view this chart, keep in mind that the inversions were where the 2-year Treasury yield exceeded the 10-year Treasury yield – which is not where we are now.
Right now, it is merely that the 2-3-year Treasury yield exceeds the 5-year Treasury yield, and there is very little history on what this development means for the economy or the markets. But here’s the chart, and I’ll explain what it means just below.
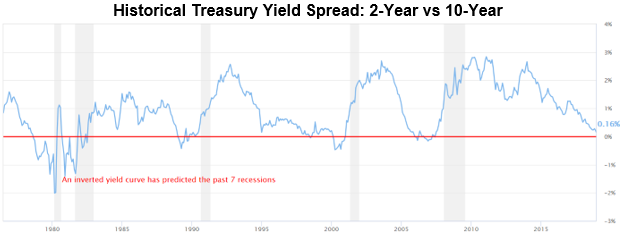
Simply put, this chart shows that the US economy has gone into recession about two years after sustained yield curve inversions. The recessions are illustrated by the light gray areas shown above.
The areas where the chart goes below the red line are periods when the yield curve inverted. The track record of the inverted yield curve predicting a recession is impressive, no doubt.
But that gets us right back to the question of whether the current yield curve is really inverted or not. For discussion purposes, I reprint the following chart again.
At the end of the day, the question is simply whether we are in an inverted yield curve environment or not. Obviously the overall yield curve is not inverted. It is clearly upward sloping.
In my view, the financial media’s depiction that we are in a significant inverted yield curve environment is clearly wrong. If I’m right, this should correct itself before long.
As Usual, The Fed is the Wild Card in All of This
We can argue all we want about whether there is currently an inverted yield curve or not, but the Federal Reserve will ultimately decide the issue, as it controls the short-term Fed Funds rate. For the last year, the Fed’s intention has been to raise the Fed Funds rate by another quarter-point at its December18-19 meeting this week and another 3-4 times in 2019.
But more recently, Fed Chairman Jerome Powell has hinted that the Fed might be willing to reduce the expected rate hikes in 2019. This is big news that the financial markets have largely ignored recently – and could significantly boost the stock markets just ahead. We’ll have to see how this plays out in the weeks to come, but I think the latest shift in the Fed’s rhetoric is significant.
Trump’s Tariff Rhetoric is The Greater Market Threat
The other big negative in the financial markets is the growing threat of a trade war with China, the world’s second largest economy behind ours. I believe that China understands the importance of trade with the US, and its leaders will do more or less what it takes to continue to accept most of our trade requirements.
Yet I continue to question whether President Trump has a similar understanding. He continues to bash China for its large trade deficit with the US. He does not seem to understand that it is perfectly normal for the world’s largest economy (the US) to have a large trade deficit with the world’s second largest economy (China).
Not only does President Trump threaten China with new trade sanctions, he also threatens Europe and some of our other international trade partners. He recently elevated his trade rhetoric saying he is a “tariff man.” This sent a very bad signal to the financial markets.
Trump is a very difficult president to understand. On the one hand, he is very pro-growth with his tax cuts and deregulation. On the other hand, he favors trade tariffs and punishing countries that run trade surpluses with us.
The bottom line is his anti-trade rhetoric is hurting the stock markets in addition to all the media blah-blah about the inverted yield curve.
Government Shutdown & Holiday Writing Schedule
It remains to be seen if we’ll have a partial government shutdown this Friday. The thing to keep in mind this go-round is that apprx. 75% of the federal budget for next year is already funded. I have included a good article in the links below on how a partial government shutdown just ahead will affect federal services.
With Christmas and New Year’s falling on Tuesdays this holiday season, I’m thinking I’ll publish this E-Letter on Christmas Eve and New Year’s Eve. I’ll definitely be spending Christmas Eve, Christmas Day and most of the day after with family. Both kids will be home with their spouse/fiancé and I’ll be cooking for everyone. What fun!
Let me close by wishing you a very Merry Christmas, or whatever holiday you are celebrating, and a Happy and Prosperous New Year! Thank you as always for your continued confidence!!
Warmest holiday wishes,
Gary D. Halbert
SPECIAL ARTICLES
How a Government Shutdown Could Affect Federal Services
Yield Curve Flattening… Just Like It Always Does in Fed Rate Hiking Cycles
Gary’s Between the Lines Blog: Fed’s Long History of Bowing to Presidents’ Wishes

