
“With solid household and business confidence, healthy levels of job creation, rising incomes, and fiscal stimulus arriving, there is good reason to expect that this strong performance will continue….” – Federal Reserve Chairman Jerome Powell in Jackson Hole
[timeless]
Q2 hedge fund letters, conference, scoops etc
It’s late summer and I hope this note finds you with vacation on your mind. A beach chair, a sun umbrella and cold beverage would be nice. Three observations to share with you this week. Let’s move fast and take a look at the record bull market run, high-yield junk bonds as an economic warning signal and the Fed.
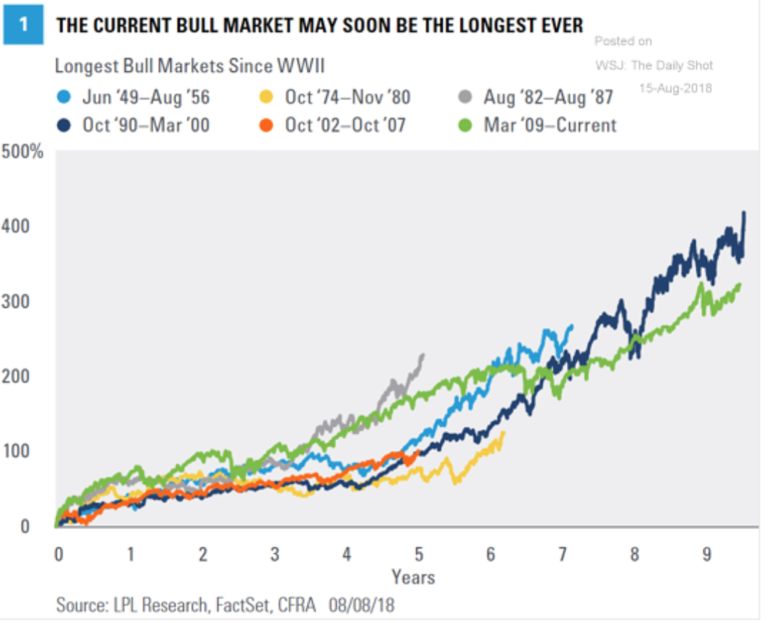
Record Bull Market Run
The current bull market is now the longest on record, surpassing the 1990-2000 bull market record of 3,452 days. Here is a quick look at all of the other bull markets since 1949 (note the percentage gains).

I tweeted this message out earlier in the week.
Responding to that post, a thoughtful advisor responded, “Remember the negative returns for ten years that followed the last bull market.” It’s hard to forget.
Here is a quick look at the history of bull and bear markets: stock market, bond market and commodity market.
High-yield Junk Bond Market Signal
Since the early 1990s, I’ve been trading the intermediate-term trend in high-yield bonds (also known as junk bonds, but that’s a less friendly name). I learned that the HY bond market is an excellent leading indicator for both the economy and the stock market.
High-yield bonds are risky bonds and since I began trading, I believe they have never been riskier. I remember when Michael Milken, the father of the junk bond market, was headed to prison and his firm, Drexel Burnham, was going out of business. I thought my newfound niche of trend following (market timing junk bond mutual funds) was doomed. It was not.
Trading the trend in the HY space isn’t complex. Pick a moving average and buy when the price moves above it and sell when the price moves below. I always told my kids that I can teach them to do it. “The family secret recipe…” But the hard part comes at two entirely different periods in time. One of them is now. I’ll explain:
In 1998 and 1999, stocks were awesome… especially tech stocks. The HY market did fine, gaining approximately 15% per year during those two years. Stocks were up more than double that. Then the HY sell signal came. We moved to cash. Clients weren’t happy with HY vs. tech. I took some heat, yet I stood my ground.
From 2000-October 2002, the S&P 500 declined 50% and tech declined 75%. Stock accounts of $1 million dropped to $500,000 or $250,000, depending on what you owned. Accounts of $1 million in a HY trend-following strategy grew to approximately $1.2 million.
Then the buy signal came in 2002. The world was broken, HY bonds were yielding in the high teens, many companies had defaulted and sellers had panicked out. Nervous, I stuck to my process and traded back in.
Then came the Great Financial Crisis. Same emotions at the top, fear at the bottom but that fear was greater. The viability of the entire financial system was in question. The buy signal came in late 2008. I was scared, had a few whipsaw trades, but I stuck to my process buying back into HY bond funds. Prices had halved and yields were over 20%.
Milken, Tech Bubble, Great Financial Crisis… Big events, but today high-yield junk bonds have never been more richly priced while at the same time the underlying quality of the bonds has never been worse. I sit here so excited about what the opportunity ahead will bring, but I also sit in great frustration with the low current return potential. Some periods in time simply require more patience.
I came across this chart this week. It’s worth watching. High-yield bond prices tend to be a leading indicator for stocks. The lead time in my experience is 12 to 18 months. What this chart shows is that when high-yield prices (in this chart the Pimco HY mutual fund is used as a proxy to show the trend in price) diverge from the S&P 500 Index, trouble in the equity market has followed. Shown at the top of the chart are the divergences in 1998-99, 2007-08 and 2017-18. (Source: Chris Kimble.)

I like how he said, “It Doesn’t Matter Until It Matters!”
Keep the current divergence in the back of your mind. I post my HY bond market signal each week in Trade Signals (currently in a buy signal). Note that when you are a trend-following trader, there are a number of whipsaw trades. I deal with them. As my father used to say, “The prize is worth the price.”
Lastly, there have been three major buying opportunities in my nearly 28 years of trading HY. They were all outstanding. Today, the current return potential for HY is at the worst I’ve seen in all the years. However, I believe the next great buying opportunity will occur at prices 50 percent lower than today and yields will be north of 20 percent. Number four is around the corner (it will present in the next recession). When I feel as scared as I did when the prior three presented, I’ll know it will be good. Currently, I see no sign of recession in the next six to nine months. (I’ll share those indicators with you soon.)
A reminder of bull and bear markets:
- Top section is the S&P 500.
- Green shows bull markets, red/white shows bear markets.
- Note annualized returns across the top of each zone.
- Also note the gray box showing GPA or Gains Per Annum when in “Secular Bull” vs “Secular Bear.” I also like the “% Time” data that shows the percent of time since 1900 that the market was in secular bull and secular bear cycles.
- Middle section is the Long-Term Government Bond Yields.
- When bond yields drop, bond prices rise. Note that this section is showing the percent change in yield and not the gain in bond prices.
- Bottom section is the NDR Commodity Composite.
- Currently, commodities are in a secular bear market cycle.
We are late cycle – watch HY price trends. HY price is an excellent leading economic indicator.
Jackson Hole – The Fed
Fed Chairman Jerome Powell spoke this morning. Here are the bullet points:
- Chairman Powell spoke at the Fed’s annual symposium at Jackson Hole, Wyoming, delivering a speech that the market watches closely for clues about the monetary policy path ahead.
- He sees “further, gradual” rate hikes ahead as economy continues to hum.
- The central bank leader said the economy is “strong” and can handle more normalization of policy.
On inflation:
- Should inflation expectations become unanchored in either direction, the Fed would “do whatever it takes to control the problem,” he said.
- More broadly, though, Powell said current conditions don’t suggest an issue with inflation expectations. The Fed targets two percent as a healthy level and the current data suggests the economy is at or around that level. However, Powell said he doesn’t see inflation moving materially higher in an economy that he said is performing well.
- “With solid household and business confidence, healthy levels of job creation, rising incomes and fiscal stimulus arriving, there is good reason to expect that this strong performance will continue,” he said. (Source: CNBC.)
Here is a look at the rate cycle since 2008. Note the first hike in 2015:
The market is pricing in a 92.3% probability of a September Fed rate hike.
This from Atlanta Fed President Bostic’s comments on Monday:
- The economy does NOT need as much stimulus as before.
- U.S. employment is “very, very low”; GDP is strong.
- Fed is trying to get back to a neutral stance on a “gradual walk.”
- The Fed’s aim is to keep the balance sheet unwind running in the background.
- An inverted yield curve does NOT guarantee recession.
- The Fed is worried about the flatness of the yield curve.
- He won’t vote for policies that invert the curve.
- The Fed is doing pretty well on its inflation objective.
The current Fed Funds Target Rate has an upper bound of 2%. With CPI running 2.9% y/y, Bostic implies that there should be three or four more Fed rate hikes, depending on the moving CPI target. Four more hikes takes us to 3% or higher on the Fed Funds Rate. With so much outstanding debt in the system, at which point do higher rates hurt? I sense sooner vs. later.
Bottom line: The point is the Fed remains on the rate-increasing path. Markets ultimately run into trouble when rates rise. There is an old Wall Street rule called “Three Steps and a Stumble.” Read on to see the chart below. If you are a bit of a chart geek like me, I think you’ll agree it’s pretty cool. Current starting conditions — we are late cycle… Hedge your bets!
Grab a coffee and find your favorite chair. The latest Trade Signals post is below.
♦ If you are not signed up to receive my weekly On My Radar e-newsletter, you can subscribe here. ♦
Follow me on Twitter @SBlumenthalCMG
Included in this week’s On My Radar:
- Three Steps and a Stumble Sell Signals (Chart)
- Trade Signals — Equity Bull Market Trend Remains (Wall Street Record 3,453 Days – Longest Rally Ever)
- Personal Note — End of August
Three Steps and a Stumble Sell Signals (Chart)
Here is how you read the chart:
- “S” with down arrows = sell signals (the point in time the Fed raised rates three consecutive times).
- “B” with up arrows = buy signals (the point in time the Fed lowered rates two consecutive times).
And here are the statistics:
My favorite indicator for stocks is the Ned Davis Research CMG U.S. Large Cap Long/Flat Index. It remains in a buy signal, as you’ll see below.
Trade Signals — Equity Bull Market Trend Remains (Wall Street Record 3,453 Days – Longest Rally Ever)
S&P 500 Index — 2,862 (08-22-2018)
Following is a look at the most recent “Dashboard.”
For additional commentary, click HERE for the latest Trade Signals.
Important note: Not a recommendation for you to buy or sell any security. For information purposes only. Please talk with your advisor about needs, goals, time horizon and risk tolerances.
Long-time readers know that I am a big fan of Ned Davis Research. I’ve been a client for years and value their service. If you’re interested in learning more about NDR, please call John P. Kornack Jr., Institutional Sales Manager, at 617-279-4876. John’s email address is jkornack@ndr.com. I am not compensated in any way by NDR. I’m just a fan of their work.
Personal Note — End of August
My plan is to head to Penn State this weekend, so I’m rushing to hit the send button. A soccer alumni reunion is planned along with a half-time tribute to my late great coach, Walter Bahr. Of course, the “Ski Team House,” as son Matthew affectionately calls his rundown duplex (which he and his roommates love), needs a better TV and since dad finally made an upgrade to a 4K TV, a hand me down is available. I’m really looking forward to seeing some old friends and of course honoring coach, his beautiful wife Davies and their family.
I’ll be in Denver mid-week next week and hope to sneak away with Susan to the beach for a day or two before Labor Day. I do hope this note finds you well with plans to slow down and get away.
Have a wonderful weekend!
♦ If you are not signed up to receive my weekly On My Radar e-newsletter, you can subscribe here. ♦
With kind regards,
Steve
Stephen B. Blumenthal
Executive Chairman & CIO

