
- The Fed’s new Underlying Inflation Gauge (UIG) incorporates asset prices, an acknowledgement of what was sorely missing in the years that led up to the financial crisis.
- This time a year ago, the UIG was at 2.54%, well above the Fed’s 2% inflation target for 11 straight months. It hit 3.20% in April.
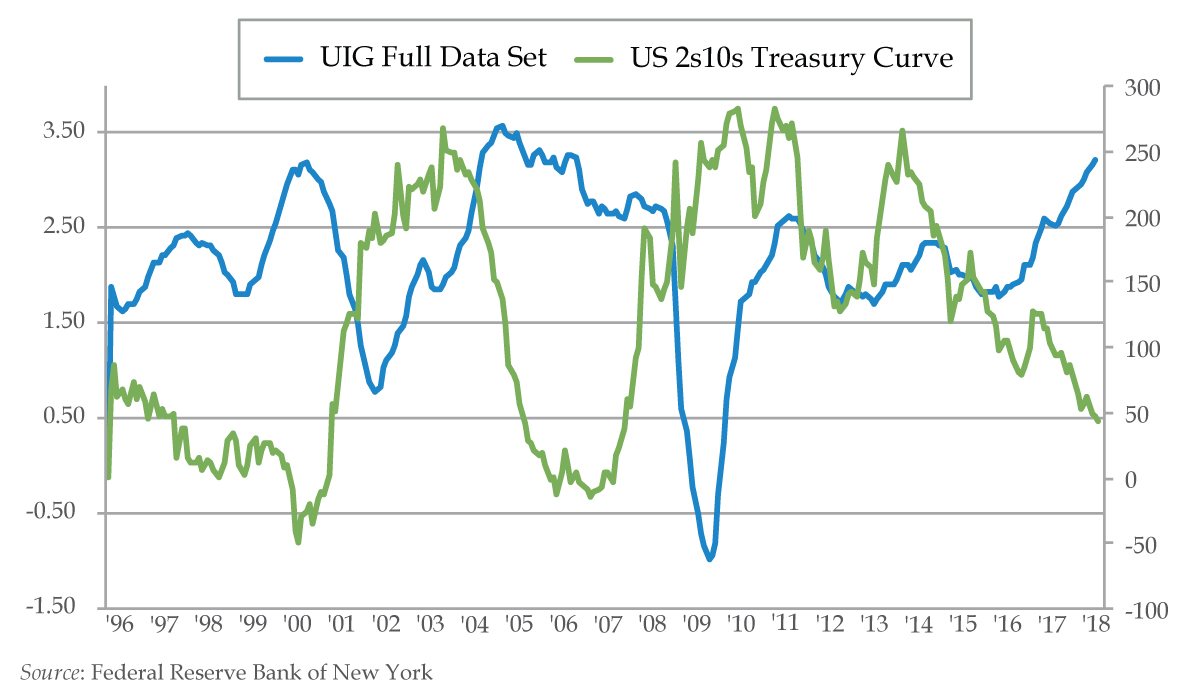
- When the Fed was tightening in 2000, the economy went from Y2K fears to overheating labor market and the UIG north of 3%, leading the 2-year/10-year spread to simultaneously invert.
- The long end, rather than being a historical reflection of inflation expectations might instead be more bullied by what the Fed does with short term rates and worries about what that means for the US economy.
- The risk is that full employment has already arrived and that the Fed’s forecast for the unemployment rate to hit 3.5% coincides with an economy that flames out allowing inflation to overshoot.
Q1 hedge fund letters, conference, scoops etc, Also read Lear Capital: Financial Products You Should Avoid?
One year ago, the New York Federal Reserve did something revolutionary. The Underlying Inflation Gauge (UIG) was introduced, an inflation metric that, “extends beyond price variables and displays greater forecast accuracy than various measures of core inflation.” Rather than solely focus on the prices of goods and services that exchange hands, the NY Fed incorporated asset prices, an acknowledgement of what was sorely missing in the years that led up to the financial crisis.
How serious is the UIG? For starters, one of UIG’s architects is Simon Potter, Head of the NY Markets Desk and the second most powerful person in the most influential Fed District. This month, the San Francisco Fed’s John Williams assumes the helm at the NY Fed. Given Williams once spoke of not having a Bloomberg terminal, it’s fair to say he will rely on his Markets Desk second-in-command.
As for the UIG’s construct, it’s safe to assume any inflation gauge that tracks asset prices would be appreciably higher than one that excludes them given asset prices are sporting record valuations. One year ago, the UIG was at 2.54%, well above the Fed’s 2% inflation target as it has been for 11 straight months. It hit 3.20% in April. With stock prices rallying hard, look for today’s May release to run even hotter.
Central bankers would not be central bankers if they didn’t back test. It is helpful to view the UIG’s theoretical past during Fed tightening cycles. When the Fed was tightening in 2000, the economy went from Y2K fears to overheating labor market and the UIG north of 3%, leading the 2-year/10-year spread to simultaneously invert. When UIG was north of 3% in the 2004-2006 cycle, the inversion took much longer with a very predictable Fed tightening and labor market not nearly as tight.
One critical distinction between the past two cycles is the starting point of the yield curve. Today, the 2s/10s spread is at about 36 basis points (bps). It had already flattened to 50 bps by last Dec, before the UIG even pierced 3%. In the prior two episodes, the basis-point differential between the 2s/10s was in the triple digits.
This third episode has less margin for error, which should worry the Fed. But many Fed officials believe their tightening campaign will lead to yield curve steepening and not impinge financial sector intermediation.
What if the Fed’s plans backfire? As gradual as the Fed’s tightening path has been, what if the rise in short-term rates tied to the Fed raising rates combined with Quantitative Tightening squeeze inflation expectations out of the long end of the curve to the point of the curve inverting?
What might be happening here is the short end of the curve is the most sensitive to inflation expectations because it’s what gets the Fed to react with short term rates. The long end, rather than being a historical reflection of inflation expectations might instead be more bullied by what the Fed does with short term rates and worries about what that means for the US economy. Thus, a flattening of the yield curve.
The Fed should know it’s playing with fire. As many times in recent months as it’s appeared, curve steepening is taking hold, and the economic reality of higher rates clashing with record debt levels comes home to roost.
The risk is that full employment has already arrived and that the Fed’s forecast for the unemployment rate to hit 3.5% coincides with an economy that flames out allowing inflation to overshoot. FedSpeak suggests tolerance for inflation running too hot the UIG clearly validates that view. But tightening past the full employment expiration date is the economic equivalent that ranks right up there with spoiled milk.
Once it’s clear inversion is imminent, fear will not be far behind. If you’re wondering what the missing ingredient is for cooking up a recession, it’s fear and fear alone. Fear is nonlinear, and recessions are nonlinear events precisely because the status quo changes as asymmetric fear of higher unemployment takes hold.
How far above target will the Fed allow the UIG to drift? It’s safe to say we’re finding out in real time.

