
“The way to build long-term returns is through preservation of capital and home runs.”
“Everyone sort of lives with their rulers in the past and doesn’t look at coming changes.”
“Earnings don’t move the overall market; it’s the Federal Reserve Board… focus on the central banks, and focus on the movement of liquidity… most people in the market are looking for earnings and conventional measures. It’s liquidity that moves markets.” – Stanley Druckenmiller
Q2 hedge fund letters, conference, scoops etc
There are several takeaways from my time fishing in Maine last week that I feel are important to share with you. And they may surprise you as they did me. I learned a great deal. For new readers, I was in northern Maine last week fishing and debating with senior economists, former Fed officials, fund managers and journalists at what is now known as Camp Kotok, an annual gathering organized by David Kotok. Revealing to you the true investment geek in me, I felt like a kid in a candy store.
You can imagine how much learning is gained in one-on-one and group discussions as convictions are strong, openly debated and tested. Top of mind, of course, was the Fed, the end of QE, the business cycle (aged), debt, investment markets and the direction of interest rates.
I quoted Jamie Dimon, Chairman of the Board and CEO of JPMorgan Chase last week. He said, “I don’t want to scare the public, but we’ve never had QE. We’ve never had the reversal. Regulations are different. Monetary transmission is different. Governments have borrowed too much debt, and people can panic when things change.” You can imagine the direction of our discussions as we are all trying to figure out what’s next.
Earnings have finally come to life. They’ve been great. It was a topic that came up at camp. Investors are feeling more comfortable and confidence is high as is their allocations to equities; however, this is normal late business cycle stuff. Last week, I shared a chart with you showing what equity market returns look like based on the percentage individual investors have invested in stocks. I discussed this with my friends in Maine. We are in the top 5% of all readings since 1951. The implications: Expect subsequent 10-year returns to be low if history is any guide. Data here. If I could express a general sense of discussions around the equity markets, I’d describe the overall tone in regards to equities as cautiously less bearish and in some cases very bullish.
“Earnings don’t move the overall market; it’s the Fed…” Now, I personally think there is more run left in the run but I recommend participating but with a risk management plan firmly in place. Note below, the equity market Trade Signals remain bullish. The point I shared with my friends was don’t bite on the earnings good news. They don’t matter like you think over the short term. They were abysmal in 2009, ‘10 and ‘11 and for a number of years that followed… now they are strong. When was it best to buy… then or now? We are seeing late cycle behavior, equities are richly priced and the Fed is raising rates. “Earnings don’t move the overall market; it’s the Fed…”
I hope that gives you a quick feel for my time at Camp Kotok, but let’s go into what I felt were my most important learnings.
- What I learned at Fishing Camp
- The Bonds on the Fed Balance Sheet Will Simply Evaporate Away When They Mature
- On Interest Rates - My View - Higher Short Term, Lower Again Long Term
- Bank of Japan Plotting Retreat from Stimulus
- Why the Yield Curve is Flat & Why It May Steepen
- Trade Signals - Equities Remain Moderately Bullish, Bearish on High Quality Bonds
- Personal Note - August and School is Approaching
What I learned at Fishing Camp
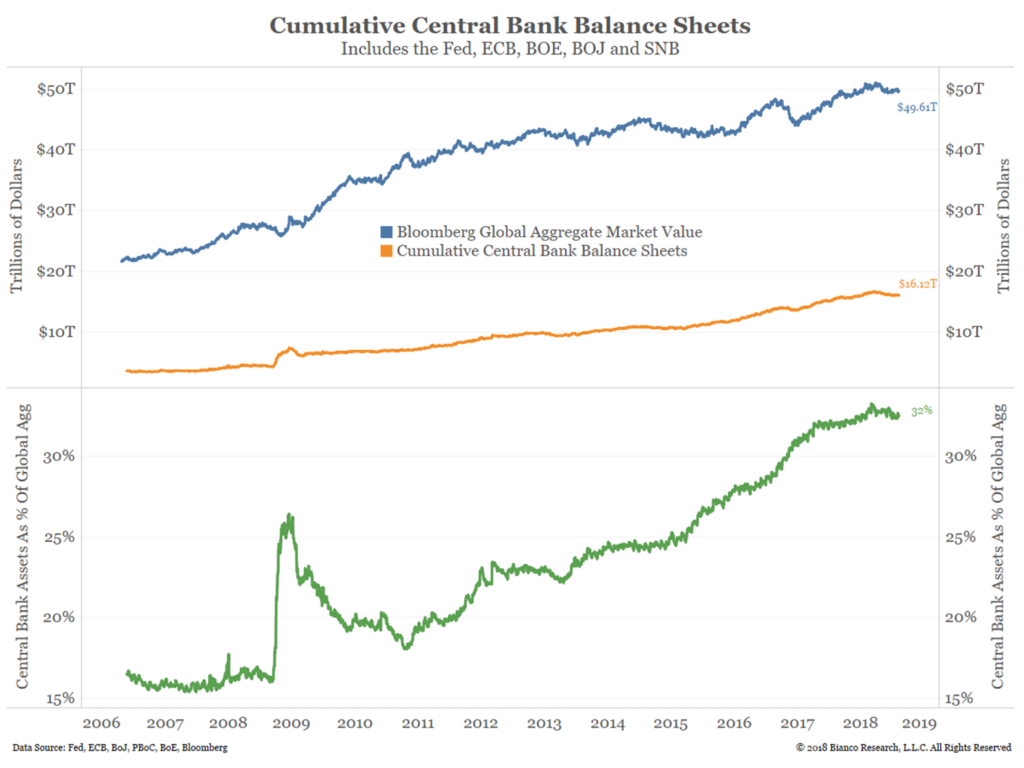
I arrived on Thursday afternoon, grabbed a chair and joined a few old and new friends already gathered at a large round table. The discussion was ongoing and it was about the Fed. Good friend, Jim Bianco, shared a chart showing the aggregate balance sheets of the top six global central banks and said, “The ECB and China (recently) continue to provide liquidity.” His point: You have to look at the aggregate global liquidity and not just the Fed. “Until the ECB switches gears,” my friend argued, “we will likely see continued low volatility and support for risk assets.” I think he’s right on both aggregate global liquidity and risk assets. We’ve never before seen such coordinated central bank liquidity.
Here is a look at the chart Jim shared with me:
- See the red arrow “We are here.” Just under $22 trillion sits on the cumulative central bank balance sheets… Data includes PBOC (China) and the Swiss National Bank’s balance sheet.
- The recent dip is mostly related to the dollar’s strength and not central bank selling. Point is they, in aggregate, remain accommodative.
- Quantitative Tightening (QT) has not yet begun.

Next is a similar view but looks only at the big four:

The Fed’s balance sheet is over $4 trillion. They own mostly U.S. Treasury notes and bonds and to a lesser degree, mortgage-backed securities. In came the rescue, the Treasury printed money and the Fed used that money to buy government bonds. The bonds were mostly bought from the banks. The banks took those proceeds and deposited the money back on reserve at the Fed and the Fed paid interest on that money less a cost to the banks for those reserve deposits. Recall that mortgage paper was not looking so good back in 2009. In simple terms, the Fed came in and bailed out the banks. That was important back then.
The Fed’s bond buying helped send interest rates lower and bond prices higher, much of the liquidity remained trapped on the Fed’s books (the banks deposited their proceeds back on reserve at the Fed) so it didn’t find its way into the economy as stimulus. The banks could have lent more but regulations were changed reducing their leverage ratios and borrowers had little appetite to borrow more. So net-net not stimulative to the system. That’s important to remember so store that and the $4 trillion number in the back of your head for a moment.
But other banks were printing and buying. Mario Draghi said he’d do “whatever it takes.” And do he did… The ECB is running out of bonds to buy. And that promise remains in place. Japan has been printing, buying Japanese bonds and ETFs and owns the majority of both of those markets. Do you think they care what price they pay. No. But a “beautiful deleveraging” ongoing? Jamie Dimon is worried; most of the attendees at the conference are worried and I’m worried, however, we just don’t yet know.
Post conference, Jim sent me a note. To give you a feel for just how big the central bank balances sheets are on a relative basis, Jim said, “The next chart offers another way to look at central bank involvement in the markets. Their balance sheets are now large enough to own roughly one-third of the bonds in the Bloomberg Global Aggregate Index.” ONE-THIRD! (Emphasis mine)

The Bonds on the Fed Balance Sheet Will Simply Evaporate Away When They Mature
The biggest aha moment for me happened at dinner on Saturday night. Sitting next to me was a former senior Fed insider. I wanted to know his thoughts: How does the Fed plan to unwind QE? Does the Fed see/believe what I and others like Ray Dalio see/believe in terms of short-term and long-term debt super cycles? The last long-term secular cycle was in 1937. So I leaned in and began asking questions.
Here’s what I learned about the $4 plus trillion on the Fed’s balance sheet:
- The Fed has no intentions to sell any of the bonds they own, they are simply going to let them roll off as they mature (that’s public knowledge),
- They carry the bonds on their books at par. There is no market-to-market gains or losses posted. The Fed collects interest from the Treasury on those bonds, pays a few expenses and sends the excess back to the Treasury,
- The bonds are carried as an asset on the Fed’s books (a government entity) and a liability on the Treasury’s books (a government entity),
- So at maturity, the Fed and the Treasury both pull out a big eraser and poof the entries on the government books offset and evaporate away. A great gig if you can get it…
- That’s the plan…
So effectively, the Fed is not implementing QT by selling bonds it owns. They are simply raising interest rates. Forget the bonds on their balance sheet. They are essentially set out to pasture and will evaporate when they mature.
I then asked, “If the outstanding debt is $21 trillion and say $3 trillion of the Fed’s $4 trillion is in Government Treasury notes and bonds, then the true debt is $21 trillion less $3 trillion.” My friend said, “Yes.” So our effective U.S. Government debt-to-GDP is just under 100%. Current GDP is $18.57 trillion and call the debt $18 trillion. Still high but I didn’t know the power to erase the debt existed. Offsetting journal entries. Got it.
That led me to my next question. “If the Treasury can print and the Fed can use that money to buy bonds on the market, is it the Fed’s plan to handshake again with the Treasury and do the same thing with say 50% of the remaining outstanding debt?” My thinking is that credible academic studies show that economic growth slows considerably after debt-to-GDP exceeds 90%. That’s been the case here and globally for the last eighteen years. We are just shy of 100% debt-to-GDP. “What if we do the same print-and-buy plan and take it to 50%?” I asked.
My friend leaned in closer, and quietly said, “There is absolutely no way the Fed will ever do that.” Adding the implications enabling legislators to act poorly is just too much risk. Too much social and economic risk. Well, amen to that. But I’m not so sure that one day we don’t find ourselves suggesting that fix. Of course, there are massive implications… inflation comes to mind but let’s not go there… the point is the Fed is not of that mindset… and, for now, that’s what we need to put in our game theory heads.
On Interest Rates – My View – Higher Short Term, Lower Again Long Term
Bottom line: None of us knows where this is going to go. The debt is having an impact and rates are rising. My best interest rate indicator, the Zweig Bond Model, continues to be bearish on high quality bonds signaling rising rates ahead. A 1% rise in rates will cost borrowers more money. It slows the economy. JPMorgan’s Dimon is talking about possibly 5% rates. That’s a bad number when you look at the overwhelming size of global debt.
Debt’s our number one global economic issue. A beautiful deleveraging balances the risks of deflation and inflation. Such risks exist on both ends of the spectrum. For now, inflation is raising its head but I feel the massive debt levels and rising rates will kick us right back into deflation. I see secular deflation and short-term cyclical inflation as the current trend. Higher rates over the coming year or so are a massive economic drag due to the implications of higher rates on debt, thus leading to the next recession… best guess 2019 or 2020 – though no current sign On My Radar.
Here’s a look at global debt. Keep in mind north of 90% debt-to-GDP limits growth. Take two aspirin before viewing…

Source: Ned Davis Research
We are at the end of a long-term debt super cycle. Global central bankers are going to have to figure out how to “burn the tally sticks” (evaporate the debt somehow). I believe it will take a crisis to rally political will to take unprecedented action. John Mauldin’s “Great Reset” remains highly probable in my view.
You’ll see in the Trade Signals post below that the trend remains modestly bullish. Interest rates are moving higher, which is not good news for high-quality bond investors. I also share two additional reads. One presents the dilemma facing the Bank of Japan. Perhaps a foreshadowing of where the U.S. will find itself at some point down the road. And do take a look at David Kotok’s post talking about the one-time defined benefit incentive (to avoid underfunding penalties) suggesting there will be large Treasury bond buying (via STRIPS) up until September 15, 2018. In short, rates on the long-end of the yield curve are currently being held down due to the incentivized buying and that incentive goes away after September 15. Expect rates to rise post that date. And finally, a great big thank you to David Kotok and his team for organizing such a wonderful event. It was an invaluable time spent with very bright and driven human beings.
Grab a coffee, read on and have a great weekend!
♦ If you are not signed up to receive my weekly On My Radar e-newsletter, you can subscribe here. ♦
Follow me on Twitter @SBlumenthalCMG
Included in this week’s On My Radar:
- Bank of Japan Plotting Retreat from Stimulus – Mauldin, Boockvar and Reuters
- Why the Yield Curve is Flat & Why It May Steepen – David R. Kotok
- Trade Signals – Equities Remain Moderately Bullish, Bearish on High Quality Bonds
- Personal Note – August and School is Approaching
Bank of Japan Plotting Retreat from Stimulus
“The latest steps marked a major turning point for Kuroda’s stimulus program,” a source said.
“The reflationists have become a minority, which means the BOJ is turning more hawkish.”
“Unwinding monetary support is far more difficult than expanding it,” said a former BOJ
policymaker who retains close contact with incumbent central bankers.”
“Everyone at the BOJ knows what they’re doing now is quite radical and needs amending at some point,” another source said.
In the above section you can see that aggregate central bank liquidity remains strong. But we know the Fed, the Bank of England and the BoJ are reversing gear.
To better understand how the Bank of Japan is trying to escape QE, John Mauldin shared the article (linked below) sent to him from Camp Kotok fishing friend, Peter Boockvar (an outstanding thinker).
Mauldin summarized the article’s Key Points:
- The BoJ can’t seem to escape its massive quantitative easing program but can’t continue indefinitely, either.
- Pushing short-term rates below zero in 2016 proved disastrous for Japanese banks and created internal BoJ divisions.
- At the same time, inflation data made raising rates almost impossible, forcing BoJ to abandon rate-hike plans this year.
- BoJ deputy governor Masayoshi Amamiya – who may well succeed Kuroda at the helm – spearheaded forward guidance as the solution that is now being implemented.
- Inflation hawks have captured a majority on the BoJ board so we can expect policy to turn even more hawkish.
Bottom Line: With the Fed, ECB and now BOJ all either tightening policy outright – or at least easing less – we are approaching a point at which interest rates move uniformly higher around the globe. While it might prevent an inverted yield curve, it could also hurt bond prices, particularly in Europe, and spark the kind of asset price-driven recession Boockvar has discussed.
Let’s conclude this section with this: Some critics, however, say the latest moves already show signs of desperation.
“It’s unclear what the BOJ really wants to do,” said one of the sources. “It’s doubtful how much the latest moves would help banks. The only thing clear is that with a dearth of policy tools, the BOJ is in a deadlock.”
Source: Here is the link to the full article from Reuters.
Why the Yield Curve is Flat & Why It May Steepen
I’m going to begin this section with David Kotok’s conclusion:
Let me sum this up. There is a tax code change and it expires on September 15. It is creating an incentive for preferred habitat buyers of US Treasury STRIPS. Those STRIPS are easily created out of new issuance by dealers. They can also be created from seasoned bonds, but new issuance makes it more predictable for dealers to meet demand. There will be US Treasury auctions of 30-year bonds in September and again in October, so we will be able to see if there is a month-over-month change in demand for long-term Treasury bonds.
There are always other influences on Treasury’s pricing and the yield curve, so it is impossible to isolate a single cause; but we have drawn inferences, and we will have some comparative evidence after the tax-break expiration on September 15.
We expect that the curve will reflect these changes after the September Treasury bond auction, which is tentatively scheduled to occur before September 15. So while the Fed may raise the short-term rate in September, the yield curve may not flatten as much as some people think it might. In fact, the curve may surprise them and actually steepen due to the expiration of this unique tax effect.
Here is the full piece from David:
“We will offer readers a few references so they can become quick studies on why certain changes in the tax code are distorting the shape of the yield curve (flattening it) and why that distorting effect will change in about six weeks.
The first link is to BDO. It describes the defined-benefit pension plan funding issue that applies.https://www.bdo.com/insights/assurance/employee-benefit-plan-audits/carpe-diem!-accelerating-defined-benefit-funding-t.
Now here’s Deloitte on this subject.https://www2.deloitte.com/content/dam/Deloitte/us/Documents/Tax/us-tax-considerations-for-accelerating-deductions-for-qualified-retirement-plans.pdf.
Let’s try this in English.
If you are a corporation and have an unfunded defined-benefit pension liability, and you fund it before September 15, you can take the tax deduction at the old 35% corporate income tax rate. After September 15, that deduction rate drops to 21%. Obviously, if you know your liability and/or can estimate it, you can fund now whether you have the cash or must borrow it. By doing so, you save 14% of the payment you might otherwise have to make.
The next incentive is the fact that if you are underfunded, your Pension Benefit Guarantee Corporation (PBGC) underfunded penalty rate will be rising next year. So funding now saves you a future and rising cost while it also absolutely saves you tax dollars.
Last, another incentive is that, when you improve your funding ratio, your penalty rate assessed by PBGC goes down.
So what happens to the money once you fund it? By using Treasury STRIPS (a zero-coupon, compounding US Treasury obligation that is financially engineered by dealers from longer-term US Treasury notes and bonds) you can lock up the funding of your long-term pension liabilities. When you do, your creditworthiness according to rating agencies goes up, and your funding ratio is more secure. Fixed-rate instruments are treated differently from variable-rate assets (stocks) when PBGC determines underfunding penalties.
Here’s a sample calculation. Suppose your unfunded liability estimate for 30 years from now is $100 million. You can neutralize it fully funded today for $40 million by purchasing a 30-year strip. You save 14% of $40 million ($5.6 million) if you do it before September 15. You also obtain other benefits like a lower PBGC rate, which you can use for your next-year earnings projections. All these favorable adjustments will appear in your third-quarter filings if you are a public company.
Put this all together and there are huge incentives for certain companies to buy US Treasury STRIPS, and those companies have been doing so in increasing amounts.
Barclays reports that US Treasury stripping activity has accelerated. Here are numbers from the US Treasury. (We present them in first-half-of-year increments so there is no seasonality distortion.) H1 2015 stripping was $1 billion; H1 2016 was $6 billion; H1 2017 was $14 billion; and H1 2018 was $26 billion. Note that the US Treasury auctions about $14 billion of 30-year bonds each month. So in the first half of this 2018 year the equivalent of about 1/3 of the newly created long bonds were stripped. For the corresponding period in the previous year that was about 1/6.
Part of this stripping increase is due to the rising allocation to fixed income as the stock market has risen. That allocation is up from about 39% directed to fixed income in 2013 to 45% in 2017. Remember that a rising allocation to fixed lowers the penalty from PBGC.
But the other part of this increase in stripping is motivated by the tax code changes. There is no way to know just how much each is responsible for, but we do know that the stock market was essentially flat in H1 except for the FANG stocks. So we can infer that a great deal of the jump in stripping was due to the effect of the special tax treatment.
There is currently no way to know what happens after September 15, when the tax break expires. But we can draw some inferences.
We know that pension funding is rising and pension plan underfunding is falling. And we certainly know there are strong incentives to act before September 15. Note that this incentive applies to the private sector and not to public-sector underfunding. Public entities do not pay federal income taxes.
Stripped Treasury securities tend to be held to maturity by many buyers. Pensions are a key example. These are called “preferred habitat” investors switching to a market segmentation approach. Here is a pretty good definition and discussion. When you consult this link on Wikipedia, scroll down to section 3.3 for the details on preferred habitat and on market segmentation, which are applicable now. These factors are altering the yield curve. https://en.wikipedia.org/wiki/Yield_curve .
Let me sum this up. There is a tax code change, and it expires on September 15. It is creating an incentive for preferred habitat buyers of US Treasury STRIPS. Those STRIPS are easily created out of new issuance by dealers. They can also be created from seasoned bonds, but new issuance makes it more predictable for dealers to meet demand. There will be US Treasury auctions of 30-year bonds in September and again in October, so we will be able to see if there is a month-over-month change in demand for long-term Treasury bonds.
There are always other influences on Treasuries pricing and the yield curve, so it is impossible to isolate a single cause; but we have drawn inferences, and we will have some comparative evidence after the tax-break expiration on September 15.
We expect that the curve will reflect these changes after the September Treasury bond auction, which is tentatively scheduled to occur before September 15. So while the Fed may raise the short-term rate in September, the yield curve may not flatten as much as some people think it might. In fact, the curve may surprise them and actually steepen due to the expiration of this unique tax effect.
For bond portfolios, this is exactly why we feel that barbells with changing duration in active management are far superior to passive ladders.
Trade Signals – Equities Remain Moderately Bullish, Bearish on High Quality Bonds
S&P 500 Index — 2,857 (08-08-2018)
In the dashboard section above, I noted that inflation pressures are high. But what does that mean for equities? One of the charts I frequently watch, provided below, looks at the annual rate of change in the Consumer Price Index (CPI). Note the buy and sell signals on the chart (arrows). Buy signals are generated when the CPI year-to-year change in the CPI crosses below its six-month smoothed moving average line. Sell signals are generated when it rises above the line by 0.6%. The current year-to-year change is 2.90%, which is 0.4% above its six-month smoothing, so this process remains in a buy yet nearing a sell (should inflation continue to accelerate). Annualized returns are shown in the upper left-hand side of the chart. Bottom line: higher inflation leads to higher interest rates, which will impact consumers and businesses. When debt is high, it is more concerning. To be watched… Here’s the chart:
It’s been a good week for the stock market. My favorite large-cap equity market risk-on/risk-off indicator, the Ned Davis Research (NDR) CMG Large Cap Long/Flat Index, continues to signal 80% exposure to large-cap stocks. Aggressive signals call for 100% exposure, moderate exposure 80%, conservative exposure 40% and 0% when the trend model reading is extremely bearish. (Explained below.) Also signaling risk-on is that the 13-week shorter-term moving average trend line remains above the longer-term 34-week MA line and volume demand continues to be stronger than volume supply.
As for the bond markets, the Zweig Bond Model remains in a sell, suggesting risk of higher interest rates. It has been a good indicator for me over the years and has done a good job YTD. The HY bond market remains bullish — the CMG Managed High Yield Bond Program signal remains in a buy signal. Gold remains in a confirmed down trend — sell signal.
On the economic front, the economy is strong, inflationary pressures are high and our indicators see little sign of recession in the next 6-9 months.
I expect the next several months to be challenging. Stay alert and risk minded. Participate and protect… seek growth opportunities while maintaining a level of protection in down markets. That’s where I believe trend-following strategies help.
Click HERE for the latest Trade Signals.
Important note: Not a recommendation for you to buy or sell any security. For information purposes only. Please talk with your advisor about needs, goals, time horizon and risk tolerances.
Long-time readers know that I am a big fan of Ned Davis Research. I’ve been a client for years and value their service. If you’re interested in learning more about NDR, please call John P. Kornack Jr., Institutional Sales Manager, at 617-279-4876. John’s email address is jkornack@ndr.com. I am not compensated in any way by NDR. I’m just a fan of their work.
Personal Note – August and School is Approaching
It’s back to school shopping time. But as the kids grow older the stuff gets bigger. I’m renting a U-Haul next Thursday and driving sons, Matthew and Kyle, to Penn State. Matt’s rented a house next to campus and in a bit of a reverse twist is getting a big ‘hand me up’ from Kyle. Kyle’s bedroom furniture is being moved into Matt’s college bedroom. Kyle’s embraced the news in good spirits. “We are here for far more important reasons than the things we have and don’t have…” I can hear my mother whisper in my ear.
Supplies, back packs, new clothes and whatever old stuff we can move out of the basement is the plan. You get the drill. I think the boys have an eye or two on one of the older TVs. Dad’s not so sure…
I hope to golf this weekend and a big early end of summer dinner is planned. Susan’s two oldest boys are also moving to school next week. It’s going to feel way too quiet at home I’m afraid but adjust we must. Ever forward…
Denver is up next at month’s end. And September is already taking shape and I have an exciting announcement to share in a few weeks.
I hope you have vacation plans in the near future.
Wishing you a cold summer beer or a fine glass of wine and time spent with those you love the most.
Have a great weekend!
♦ If you are not signed up to receive my weekly On My Radar e-newsletter, you can subscribe here. ♦
With kind regards,
Stephen B. Blumenthal
Executive Chairman & CIO

