
This is an appendix to Chapter 2, “The Big Cycle of Money, Credit, Debt, and Economic Activity.” It is intended to look at the concepts expressed in that chapter in a more granular way and to show you how these concepts are consistent with the actual cases that are behind the concepts. While in this appendix we will get a bit more into the mechanics and specifics than we did in Chapter 2, it is written in a way that should be both palatable to most people and specific enough to satisfy the needs of skilled economists and investors. If you find that the material that you are reading is getting too wonky for your taste just stick to reading that which is in bold and you should be just fine.
Q1 2020 hedge fund letters, conferences and more
Rather than carefully examining the whole cycle (which we will do in the Part 2 examinations) we will focus exclusively on big devaluations and end of reserve currency periods because a) the dollar, euro, and yen are in the late stages of their long-term debt cycles when the debts denominated in them are high, real interest rate compensations for holding these debt assets are low, and large amounts of new debt denominated in them are being created and monetized—which is a higher-risk confluence of circumstances, and b) such big devaluations and/or the loss of reserve currency status by the leading reserve currencies would be the most disruptive economic event we could imagine.
As previously explained, there is a real economy and there is a financial economy, which are intertwined but different. The real economy and the financial economy each has its own supply and demand dynamics. In this section we will focus more on the supply and demand dynamics of the financial economy to explore what determines the value of money.
Printing and Devaluing Money Is the Easiest Way out of a Debt Crisis
While people tend to think that a currency is pretty much a permanent thing and believe that “cash” is the safe asset to hold, that’s not true because all currencies devalue or die and when they do cash and bonds (which are promises to receive currency) are devalued or wiped out. That is because printing a lot of currency and devaluing debt is the most expedient way of reducing or wiping out debt burdens. When the debt burdens are sufficiently reduced or eliminated, the credit/debt expansion cycles can begin all over again, as described in Chapter 2.
As I explained more comprehensively in my book Principles for Navigating Big Debt Crises than I can explain here, there are four levers that policy makers can pull to bring debt and debt-service levels down relative to the income and cash-flow levels that are required to service one’s debts:
- Austerity (spending less)
- Debt defaults and restructurings
- Transfers of money and credit from those who have more than they need to those who have less than they need (e.g., raise taxes)
- Printing money and devaluing it
Austerity is deflationary and doesn’t last long because it’s too painful. Debt defaults and restructurings are also deflationary and painful because the debts that are wiped out or reduced in value are someone’s assets; as a result defaults and restructurings are painful for both the debtor who goes broke and has their assets taken away and for the creditor who loses the wealth arising from having to write down the debt. Transfers of money and credit from those who have more than they need to those who have less than they need (e.g., raising taxes to redistribute wealth) is politically challenging but more tolerable than the first two ways and is typically part of the resolution. In comparison to the others, printing money is the most expedient, least well-understood, and most common big way of restructuring debts. In fact it seems good rather than bad to most people because it helps to relieve debt squeezes, it’s tough to identify any harmed parties that the wealth was taken away from to provide this financial wealth (though they are the holders of money and debt assets), and in most cases it causes assets to go up in the depreciating currency that people use to measure their wealth in so that it appears that people are getting richer.
You are seeing these things happen now in response to the announcements of the sending out of large amounts of money and credit by central governments and central banks.
Note that you don’t hear anyone complaining about the money and credit creation; in fact you hear cries for a lot more with accusations that the government would be cheap and cruel if it didn’t provide more. There isn’t any acknowledging that the government doesn’t have this money that it is giving out, that the government is just us collectively rather than some rich entity, and that someone has to pay for this. Now imagine what it would have been like if government officials cut expenses to balance their budgets and asked people to do the same, allowing lots of defaults and debt restructurings, and/or they sought to redistribute wealth from those who have more of it to those who have less of it through taxing and redistributing the money. This money and credit producing path is much more acceptable. It’s like playing Monopoly in a way where the banker can make more money and redistribute it to everyone when too many of the players are going broke and getting angry. You can understand why in the Old Testament they called the year that it’s done “the year of Jubilee.”
Most people don’t pay enough attention to their currency risks. Most worry about whether their assets are going up or down in value; they rarely worry about whether their currency is going up or down. Think about it. Right now how worried are you about your currency declining relative to how worried you are about how your stocks or your other assets are doing? If you are like most people, you are not nearly as aware of your currency risk and you need to be.
So let’s explore that currency risk.
All Currencies Have Been Devalued or Died
Think about holding currencies (which is the same as holding cash) in the same way as you would think about holding any other assets. How would you have done in these investments?
Of the roughly 750 currencies that have existed since 1700, only about 20% remain, and of those that remain all have been devalued. In 1850 the world’s major currencies wouldn’t look anything like the ones today. While the dollar, pound, and Swiss franc existed back then, most others were different and have since died. In 1850 in what is now Germany, you would have used the gulden or the thaler. There was no yen, so in Japan you might have used a koban or the ryo instead. In Italy you would have used one or more of the six possible currencies. You would have used different currencies in Spain, China, and most other countries. Some were completely wiped out (in most cases they were in countries that had hyperinflation and/or lost wars and had large war debts) and replaced by entirely new currencies. Some were merged into currencies that replaced them (e.g., the individual European currencies were merged into the euro). And some remain in existence but were devalued, like the British pound and the US dollar.
What Do They Devalue Against?
The most important thing for currencies to devalue against is debt. That is because the goal of printing money is to reduce debt burdens. Debt is a promise to deliver money, so giving more money to those who need it lessens the debt burden. How this newly created money and credit then flow determines what happens next. Increases in the supply of money and credit both reduce the value of money and credit (which hurts holders of it) and relieve debt burdens. In cases in which the debt relief facilitates the flows of this money and credit into productivity and profits for companies, rising real stock prices (i.e., the value of stocks after adjusting for inflation) happens. When it sufficiently hurts the actual and prospective returns of “cash” and debt assets so that it drives flows out of these assets and into inflation-hedge assets and other currencies, that leads to a self-reinforcing decline in the value of money. At times when the central bank is faced with the choice of a) allowing real interest rates (i.e., the rate of interest minus the rate of inflation) to rise to the detriment of the economy or b) preventing real interest rates from rising by printing money and buying those cash and debt assets, they will choose the second path, which reinforces the bad returns of holding “cash” and those debt assets. The later one is in the long-term debt cycle—i.e., a) when the amounts of debt and money are impossibly large for them to be turned into real value for the amounts of goods and services they are claims on, b) when the levels of real interest rates that are low enough to save debtors from bankruptcy are below the levels that are required for creditors to hold the debt as a viable storehold of wealth, and c) when the normal central bank levers of allocating capital via interest rate changes (MP1) and/or printing money and buying high-quality debt (MP2) don’t work so that monetary policy becomes a facilitator of the political system that allocates resources in an uneconomic way—the greater the likelihood that there will be a breakdown in the currency and monetary system. So, there are a) systemically beneficial devaluations (though they are always costly to the holders of money and debt) and b) systemically destructive ones that damage the credit/capital allocation system but are required to wipe out the debt in order to create a new monetary order. It’s important to be able to tell the difference. In this study we will explore both types.
To do that I will show you the value of currencies in relation to both gold and consumer price index weighted baskets of goods and services because gold has been the timeless and universal alternative currency and because money is meant to buy goods and services so its buying power is of paramount importance. I will also touch on their value in relation to other currencies/debt and in relation to stocks because they too can be storeholds of wealth. The pictures that all these measures convey are broadly similar in big currency devaluations because the currency moves are so significant that they change in relation to most things. Because many other things (real estate, art, etc.) are also alternative storeholds of wealth, we could go on and on describing how they perform in big currency devaluations but I chose not to because that would take this past the point of diminishing returns.
In Relation to Gold
The chart below shows spot currency returns of the three major reserve currencies in relation to gold since 1600. While we will examine these in depth in this study, for now I would like to focus your attention on both the spot currency returns and the total returns of holding interest-earning cash in all the major currencies since 1850.
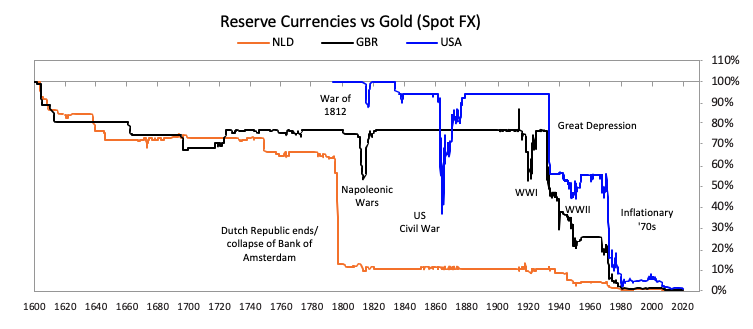
As shown in the next two charts, devaluations typically occur as relatively abrupt declines during debt crises that are separated by periods of currency stability during periods of prosperity. I noted six such ones, which we will soon delve into. Of course there were many more devaluations of more minor currencies that we won’t get into right now.


Here are some notable takeaways:
- Big devaluations have tended to be more episodic than evolutionary. There were six time frames that there were really big devaluations of major currencies (though plenty more of minor currencies) over the last 170 years.
- In the 1860s the large financing needs of the Civil War prompted the US to suspend gold convertibility and print money (known as “greenbacks”) to help monetize war debts.
- After the US returned to its prior gold peg in the mid-1870s a number of other countries joined the gold standard; most currencies remained fixed against gold up until World War I. Major exceptions were Japan (which was on a silver-linked standard until the 1890s, which led its exchange rate to devalue against gold as silver prices fell during this period), and Italy and Spain, which frequently suspended convertibility to support large fiscal deficits.
- Then came World War I when warring countries ran enormous deficits that were funded by central banks’ printing and lending of money. During the war years gold was international money as international credit was lacking because trust was lacking. Then the war ended, and a new monetary order was created with gold and the winning countries’ currencies, which were tied to it, at the center of that new monetary order.
- Still, in 1919-22 the printing of money and devaluations of several European currencies were required as an extension of the debt crises of those most indebted, especially those that lost World War I. As shown this led to the total extinction of the German mark and German mark debt in the 1920-23 period and big devaluations in other countries’ currencies including the winners of the war that also had debts that had to be devalued to create a new start.
- With the debt, domestic political, and international geopolitical restructurings done, the 1920s was a boom period, which became a bubble that burst in 1929.
- In 1930-45, 1) when the debt bubble burst that required central banks to print money and devalue it, and then 2) when the war debts had to increase to fund the war that required more printing of money and more devaluations.
- At the end of the war, in 1944-45, the new monetary system that linked the dollar to gold and other currencies to the dollar was created, and the currencies and debts of Germany, Japan, Italy, and China (and a number of other countries) were quickly and totally destroyed while those of most winners of the war were slowly but still substantially depreciated. That monetary system stayed in place until the late 1960s.
- In 1968-73 (most importantly in 1971), when excessive spending and debt creation especially by the US required the breaking of the link with gold because claims on gold were being turned in for actual gold and the claims were far greater than the amount of gold that was available to redeem the claims, that led to going to a dollar-based fiat monetary system that allowed the big increase in dollar-denominated money and credit that fueled the inflation of the 1970s and led to the debt crisis of the 1980s.
- Since 2000 the value of money has fallen in relation to the value of gold due to lots of money and credit creation and because of interest rates being low in relation to inflation rates. Because the monetary system has been a free-floating monetary system there have not been the abrupt breaks that there have been in the past; there has been a more gradual and continuous devaluation in which low or in some cases negative interest rates did not provide compensation for the increasing amount of money and credit and the resulting (albeit low) inflation.
Let’s look at these periods more closely.
As shown in the prior charts, the returns of holding currencies (i.e., short-term debt that collects interest) during the period from 1850 to 1913 were generally profitable relative to the returns of holding gold. During that more than 60-year debt/currency cycle period, most currencies were able to remain fixed against gold or silver and one would have collected an attractive interest rate because it was mostly a prosperous period in which both lending and borrowing worked well for those who did it. That prosperous period was what is known as the Second Industrial Revolution, when the borrowers turned the money they borrowed into earnings that allowed the debts to be paid back. While there were debt crises in that period (such as “the Panic of 1873,” “the Panic of 1893,” and “the Panic of 1907” in the US) they were not big enough to necessitate devaluations, though they were turbulent. For example, the prosperity of the Second Industrial Revolution led to a debt-financed speculative boom in stocks that grew overextended, which led to a banking and brokerage crisis. In the US that led to the six-week-long Panic of 1907 at the same time the large wealth gap and other social issues (e.g., women’s suffrage) caused political tensions, capitalism was challenged, and taxes started to rise to fund the wealth redistribution process.
In China, which was still a world away but impacted, there was the same dynamic—a stock market bubble led by rubber production stocks (which was China’s equivalent of America’s railroad stock bubbles that contributed to panics there throughout the 19th century) that burst and led to a crash in 1910, which some have described as a factor in a debt/money/economic downswing that contributed to the end of Imperial China. So, throughout that period the Type 2 monetary systems (i.e., with notes convertible into metal money) remained in place in most countries and holders of notes got paid good interest rates without having their currencies devalued. The big exceptions were the US devaluation to finance the Civil War debts in the 1860s, the frequent devaluations of Spain’s currency due to its continued weakening as a global power, and the sharp devaluations in Japan’s currency due to its remaining on a silver-linked standard until the 1890s (and silver prices falling relative to gold prices in this period).

World War I began in 1914 and countries borrowed a lot to fund it, which led to the late debt cycle breakdowns and devaluations that came when war debts had to be wiped out, effectively destroying the monetary systems of those who lost the war. The Paris Peace Conference that ended the war in 1918 attempted to institute a new international order around the League of Nations, but the efforts at cooperation were unable to avoid debt crises and monetary instability due to huge war indemnities placed on the defeated powers (such as Germany in the Treaty of Versailles), as well as large war debts owed by the victorious Allies to each other (particularly to the US). As shown in the chart below, that led to a complete wipeout of the value of money and credit in Germany, which led to the world’s most iconic hyperinflation in the Weimar Republic. As you will read briefly when we cover Germany’s rise and decline in Part 2 (and as you can read much more completely in my detailed examination of the Weimar Republic in Principles for Navigating Big Debt Crises) this case was the direct result of Germany having these enormous war-related debts and indemnities that had to be disposed of. The Spanish flu also occurred during the period, beginning in 1918 and ending in 1920. Coming out of the war, all currencies except the US dollar, the Japanese currency, and the Chinese currency devalued because they had to monetize some of their war debts and because not to devalue with the countries that devalued would have hurt their competitiveness in world markets. As shown in the chart below, China’s silver-based currency rallied sharply relative to gold (and gold-linked currencies) near the end of the war as prices rose and then mechanically devalued as silver prices fell sharply amid the post-war deflation in the US. That was then followed by an extended and productive period of economic prosperity, particularly in the US, that was known as the Roaring ’20s, which like all such periods, led to big debt and asset bubbles and a large wealth gap that sowed the seeds for the turbulence that lay ahead.

Next, in the 1930s you see different versions of the same thing happening in all countries—i.e., in the 1930-33 period there was a global debt crisis that led to economic contractions that led to the printing of money and competitive devaluations in virtually all countries, which eroded the value of money moving into World War II. The conflicts over wealth within countries and between countries led to greater conflicts within and between countries. All the warring countries built up war debts while the US gained a lot of wealth (gold) in the war. Then, after the war, the value of money and debt was completely wiped out for the losers of the war (i.e., Germany, Japan, and Italy), as well as for China, and was severely devalued for Great Britain and France even though they were the supposed winners of the war. I should note that during war years money and credit are not commonly accepted between countries because there is a justifiable wariness about whether they will get paid back in currency that has value. During wars gold, or in some cases silver or barter, is the coin of the realm. At such times prices and capital flows are typically controlled so it is even difficult to say what the real prices of many things are. After the war was the prosperity period that we won’t examine other than to say that within it was excessive borrowing that sowed the seeds of the next big devaluation, which happened in 1968-73.

By the mid-1950s, before that devaluation, the dollar and the Swiss franc were the only currencies worth even half of their 1850s value. As shown below, the downward pressure in currencies and upward pressure in gold started in 1968 and was made official on August 15, 1971, when President Nixon ended the Bretton Woods monetary system, leaving the Type 2 monetary system in which the dollar was backed by gold, and going to a fiat monetary system.

Since 2000 we have seen a more gradual and orderly loss of total return in currencies when measured in gold, consistent with the broad fall in real rates across countries during those decades.

In summary the basic picture is that:
- The average annual return of holding interest-earning cash currency since 1850 was 1.2%, which was a bit lower than the average real return of holding gold, which was 1.3%, though there were huge differences in their returns at various periods of time and in various countries.
- In about half of the countries since 1850 you would have received a positive real return for holding bills, in half a negative real return, and in cases like Germany you would have been totally wiped out twice.
- Most of the real return from holding interest-earning cash currency came in the periods when most countries were on gold standards that they adhered to because they were in prosperous periods (e.g., in the Second Industrial Revolution and in the post-1945 boom when debt levels and debt-service burdens were relatively low and income growth was nearly equal to debt growth) until near the end of that long cycle.
- The real (i.e., inflation-adjusted) return for bills since 1912 (the modern fiat era) has been -0.2%. The real return of gold during this era has been 2.2%. During this period you would only have made a positive real return holding interest-earning cash currency in about half of the countries, and you would have lost meaningfully in the rest (losing over 2% a year in France, Italy, and Japan, and losing over 15% a year in Germany due to the hyperinflation).

The next chart shows the real returns of holding gold throughout the period from 1850 to the present. As shown, from 1850 until 1971 gold returned (through its appreciation) an amount that equaled the amount of money lost to inflation, with the exception of Germany, though there were big variations around that average such as those previously described (e.g., until the 1930s currency devaluations and the end of World War II devaluations of money that were part of the formation of the Bretton Woods monetary system in 1944). Gold stayed steady in price while money and credit expanded until 1971. Then in 1971 currencies were devalued and delinked from gold so there was a shift from a Type 2 monetary system (e.g., notes backed by gold) to a fiat monetary system. That delinking of currencies from gold and going to a fiat monetary system gave central banks the unconstrained ability to create money and credit. In turn that led to high inflation and low real interest rates that led to the big appreciation in the real gold price until 1980-81 when interest rates were raised significantly above the inflation rate, which led currencies to strengthen and gold to fall until 2000. That is when central banks pushed interest rates down relative to inflation rates and, when they couldn’t push them any lower by normal means, printed money and bought financial assets, which was supportive to gold prices.

The Value of Currencies in Relation to Goods and Services
Thus far we have looked at the market values of currencies in relation to the market value of gold. That raises the question about how much of this picture is because we are looking at the value of currencies relative to gold and whether that is an appropriate gauge. The next chart shows the value of interest-rate-earning cash currency in terms of the CPI baskets of goods and services in these currencies, so it shows changes in buying power. As shown the two world wars were very bad, and since then there have been ups and downs. In about half of the currencies interest-rate-earning cash provided a return that was above the rate of inflation, in the other half it provided bad real returns, and in all cases, there were big and roughly 10-year-long swings around these averages. In other words, history has shown that there are very large risks in holding interest-earning cash currency as a storehold of wealth especially late in debt cycles.

The Patterns of Countries Devaluing and Losing Their Reserve Currency Status
Currencies devaluing and currencies losing their reserve currency position aren’t necessarily the same things though they are caused by the same things (debt crises) and a currency losing its reserve currency status comes from chronic and large devaluations. As previously explained, when central banks increase the supply of money and credit it reduces the value of money and credit. This is bad for holders of money and credit but a relief to debt burdens. When this debt relief allows money and credit to flow into productivity and profits for companies, real stock prices rise. But it can also damage the actual and prospective returns of “cash” and debt assets enough to drive people out of those assets and into inflation-hedge assets and other currencies. This leaves the central bank faced with the choice of either allowing real interest rates to rise to the detriment of the economy or preventing rates from rising by printing money and buying those cash and debt assets. Inevitably, they will follow the second path, which reinforces the bad returns of holding “cash” and those debt assets. As explained earlier, when it’s late in the long-term debt cycle, there is a greater likelihood that there will be a breakdown in the currency and monetary system, and the important thing is to tell the difference between systemically beneficial devaluations and systemically destructive ones.
What do these devaluations have in common?
- In the major cases we looked at, all of the economies experienced a classic “run” dynamic, as there were more claims on the central banks than there was hard currency available to satisfy the claims on that money, which was typically gold, though it was US dollars for the UK reserve currency decline because at that time the British pound was linked to the US dollar.
- Net central bank reserves start falling prior to the actual devaluation, in some cases starting years ahead of the devaluation. It’s also worth noting that in several cases countries suspended convertibility ahead of the actual devaluation of the exchange rate, such as with the UK in 1947 ahead of the 1949 devaluation, or for the US in 1971.
- The run on the currency and the devaluations typically came alongside significant debt problems, often related to wartime spending (the Fourth Anglo-Dutch War for the Dutch, the world wars for the UK, Vietnam for the US under Bretton Woods), which put pressure on the central bank to print. The worst situations were when countries lost their wars; that typically led to the total collapse and restructuring of their currencies and their economies. However, winners of wars that ended up with debts that were much larger than their assets and reduced competitiveness (e.g., Great Britain) also lost their reserve currency status, though more gradually.
- Typically central banks respond initially by not increasing the supply of money so that when their currency and debt are being sold they let short-term rates rise to forestall the devaluation, but that is too economically painful, so they quickly capitulate and devalue. Then, after the devaluation, they typically cut rates.
- After devaluation, the outcomes diverge significantly across the cases, with a key variable being how much economic and military power the country retained at the time of the devaluation, which impacted how willing savers were to continue holding their money there.
- More specifically for the major reserve currencies:
- For the Dutch, the collapse of the guilder was massive and relatively quick in taking place over less than a decade, with the actual circulation of guilders falling swiftly by the end of the Fourth Anglo-Dutch War. This collapse came as the Netherlands entered a steep decline as a world power, first losing a major war against the British and subsequently facing invasion on the continent from France.
- For the British, the decline was more gradual: it took two devaluations before it fully lost its reserve currency status, though it experienced periodic balance of payments strains over the intervening period. Many of those who continued to hold reserves in pounds did so due to political pressures and their assets significantly underperformed US assets during the same time.
- In the case of the US, there were two big abrupt devaluations (in 1933 and 1971) and more gradual devaluations against gold since 2000, but they haven’t cost the US its reserve currency status.
- Typically leading up to a country losing its reserve currency position 1) there is an already established loss of economic and political primacy to a rising rival that creates a vulnerability (e.g., the Dutch falling behind the UK or the UK falling behind the US) and 2) there are large and growing debts that are monetized by the central bank printing money and buying government debt, leading to 3) a weakening of the currency in a self-reinforcing run from the currency that can’t be stopped because the fiscal and balance of payments deficits are too great for cutbacks to close.
As this appendix is getting long, I have decided to cut it here and to follow in a few days with the rest, which consists of brief explanations of the decline phases of the Dutch guilder and British pound and their empires.
Important Disclosures
Bridgewater Daily Observations is prepared by and is the property of Bridgewater Associates, LP and is circulated for informational and educational purposes only. There is no consideration given to the specific investment needs, objectives or tolerances of any of the recipients. Additionally, Bridgewater’s actual investment positions may, and often will, vary from its conclusions discussed herein based on any number of factors, such as client investment restrictions, portfolio rebalancing and transactions costs, among others. Recipients should consult their own advisors, including tax advisors, before making any investment decision. This report is not an offer to sell or the solicitation of an offer to buy the securities or other instruments mentioned.
Bridgewater research utilizes data and information from public, private and internal sources, including data from actual Bridgewater trades. Sources include the Australian Bureau of Statistics, Bloomberg Finance L.P., Capital Economics, CBRE, Inc., CEIC Data Company Ltd., Consensus Economics Inc., Corelogic, Inc., CoStar Realty Information, Inc., CreditSights, Inc., Dealogic LLC, DTCC Data Repository (U.S.), LLC, Ecoanalitica, EPFR Global, Eurasia Group Ltd., European Money Markets Institute – EMMI, Evercore ISI, Factset Research Systems, Inc., The Financial Times Limited, GaveKal Research Ltd., Global Financial Data, Inc., Haver Analytics, Inc., ICE Data Derivatives, IHSMarkit, The Investment Funds Institute of Canada, International Energy Agency, Lombard Street Research, Mergent, Inc., Metals Focus Ltd, Moody’s Analytics, Inc., MSCI, Inc., National Bureau of Economic Research, Organisation for Economic Cooperation and Development, Pensions & Investments Research Center, Renwood Realtytrac, LLC, Rystad Energy, Inc., S&P Global Market Intelligence Inc., Sentix Gmbh, Spears & Associates, Inc., State Street Bank and Trust Company, Sun Hung Kai Financial (UK), Refinitiv, Totem Macro, United Nations, US Department of Commerce, Wind Information (Shanghai) Co Ltd, Wood Mackenzie Limited, World Bureau of Metal Statistics, and World Economic Forum. While we consider information from external sources to be reliable, we do not assume responsibility for its accuracy.
The views expressed herein are solely those of Bridgewater as of the date of this report and are subject to change without notice. Bridgewater may have a significant financial interest in one or more of the positions and/or securities or derivatives discussed. Those responsible for preparing this report receive compensation based upon various factors, including, among other things, the quality of their work and firm revenues.
Article by Ray Dalio Via LinkedIn

