
“The most important item over time in valuation is obviously interest rates…
If interest rates are destined to be at low levels, it makes any stream of earnings from investments worth more money.
The bogey is always what government bonds yield.”
– Warren Buffett on CNBC (May 2017)
“Earnings don’t move the overall market: it’s the Federal Reserve Board…
focus on the central banks, and focus on the movement of liquidity…
most people in the market are looking for earnings and conventional measures. It’s liquidity that moves markets.”
– Stan Druckenmiller
Q1 hedge fund letters, conference, scoops etc, Also read Lear Capital: Financial Products You Should Avoid?
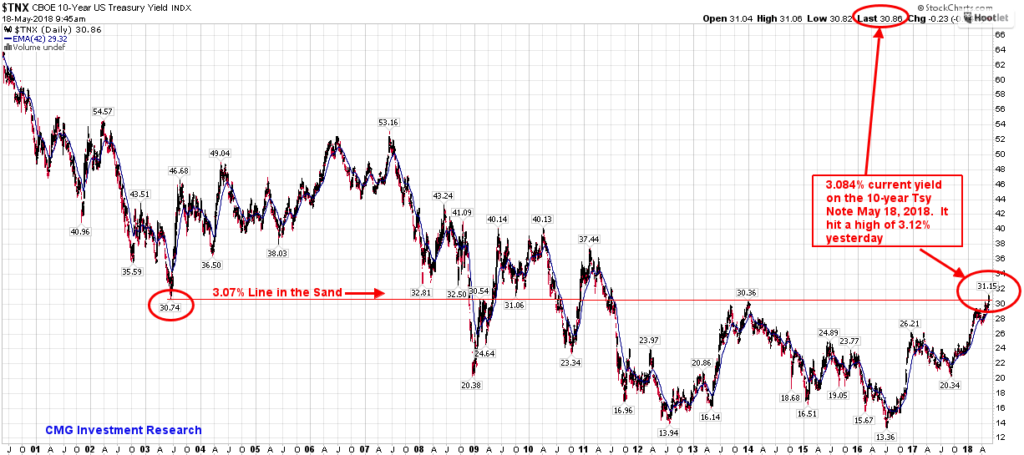
It’s been a big week for interest rates. If you have been reading my missives over the last number of weeks, you’ve read about my 3.07% “Line in the Sand” for the 10-year Treasury Note yield. Yields broke higher this week, the line in the sand was breached and interest rates are likely heading to 3.75% or 4%. That’s going to further stress the equity, fixed income and currency markets given our current conditions: high valuation levels, high debt and an aged business cycle.
Last week I wrote about The Debt Bubble and the Interest Rate Trigger. The trigger? Rising interest rates. Let’s take a look at the updated chart and then see what my favorite recession watch indicators are signaling.
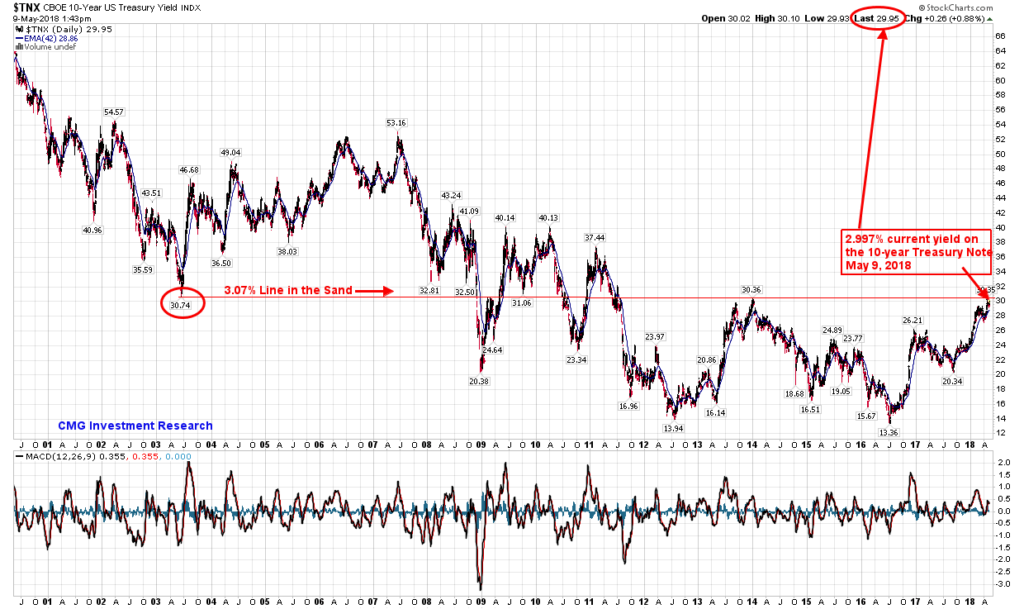
First, the 10-year Treasury Note yield. Here’s how to read the chart:
- The red circle at the top of the chart shows the current yield on the 10-year at 9:45 am on May 18, 2018.
- The red circle on the right shows the upside breakout above the 3.07% solid red “Line in the Sand.”
- The reason that line is important is that it marks the 2003 temporary low at 3.074% in yields and the 2013/2014 high at 3.036%.
- While no guarantees, as is the case with everything in life, the break higher is significant on a technical level. I expect yields to continue higher over the short term buoyed by inflation pressures and Fed policy. Target? The 2011 high at 3.744%.
Here’s what it means… from last week’s post:
As rates rise, interest payments will become a bigger burden on corporate, individual and government budgets. This is serious. Many governments will raise taxes to try to keep the game going but that will cause even more deflation. States will try to do the same. Like rate cycles past, the Fed’s higher interest rate game plan will drive us right into the recession. You’ll find a great illustrative chart in the debt section. On my radar is a #2019-2021DebtCrisis, #Recession and what John Mauldin calls “The Great Reset.” Debt’s the problem and rising interest rates are the trigger. We’ll keep a close eye on the recession watch indicators. Right now? All good…
Just how long “all good” remains to be seen. Which leads us to my favorite recession watch charts. Here is what they are telling us:
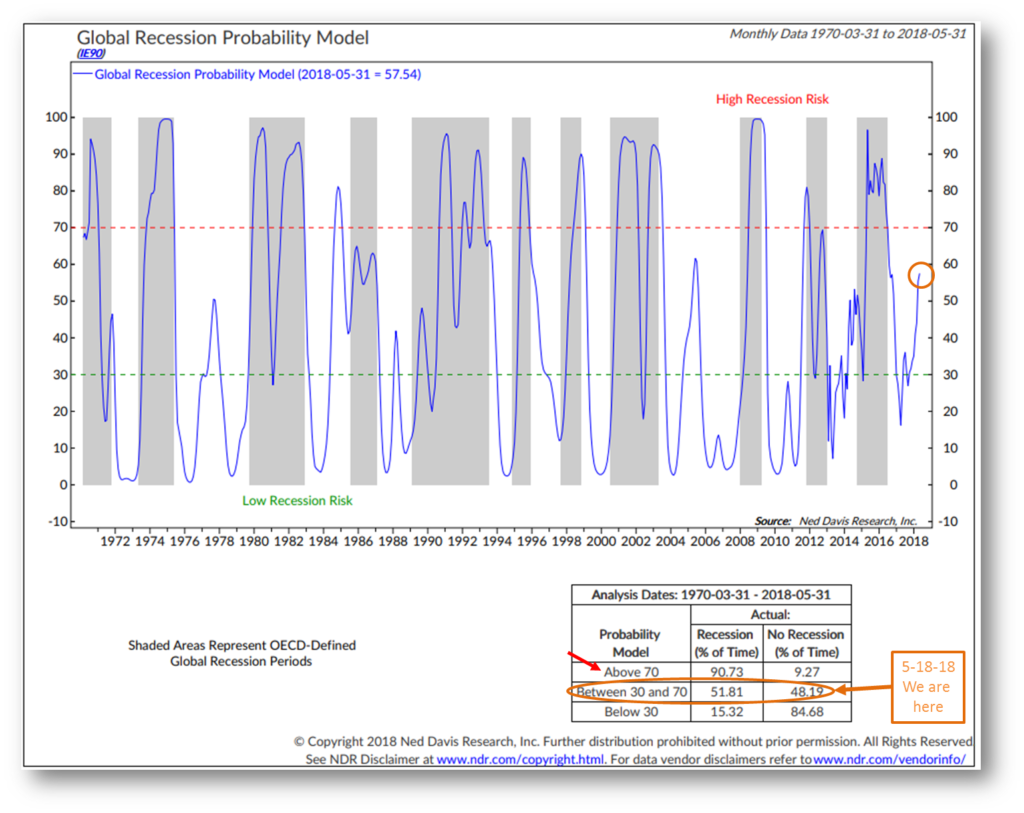
Global Recession Watch Chart
Here is how you read the chart:
- The red circle shows the current level and is signaling a 57.54% probability of recession.
- Note the dotted red line. It marks the “High Recession Risk” zone. Not there yet.
- The box in the lower right of the chart shows the time since 1970, based on the level of the probability model, that the global economy was in recession. When the reading is above 70, recession has occurred 90.73% of the time. Thus, high risk.
- When between 30 and 70, recession has occurred 51.81% of the time so we are not currently out of the woods.
- Note too that the line is increasing and the rate of ascent can be fast.
- The gray areas mark recessions.
Warning: for quant geeks only… information on NDR’s process: The chart shows the NDR Global Recession Probability Model based on the Amplitude-Adjusted Composite Leading Indicators (CLIs) created by OECD for 35 countries. Each of the leading indicators contains a wide range of economic indicators such as money supply, yield curve, building permits, consumer and business sentiment, share prices and manufacturing production. There are usually five to ten indicators, which vary by type and weight, depending on the country, and are selected based on economic significance, cyclical behavior and quality.
The Model uses a logistic regression method incorporating both the CLI level and trend data of all 35 countries to predict the likelihood of a global recession. A score above 70 indicates high recession risks while a score below 30 means low risks.
Non-geeks see Logistic Regression (for dummies) here. I had to take a look myself.
Bottom line: I look at the Global Recession Probability Model each month. The blue line continues to rise. Note how quickly the line has risen in 2018. Higher rates are going to be a serious issue. Call it a 50/50 shot at recession in early 2019. The probability will increase should the blue line continue higher. The temperature is rising. We’ll take another look again next month.
Below you will find the current U.S. recession watch charts, including the employment trends index, index of coincident economic indicators and yield curve. Bottom line: no current sign of recession.
“The most important item over time in valuation is obviously interest rates…
If interest rates are destined to be at low levels it makes any stream of earnings from investments worth more money. The bogey is always what government bonds yield.”
Warren Buffett on CNBC (May 2017)
“Earnings don’t move the overall market: it’s the Federal Reserve Board… focus on the central banks, and focus on the movement of liquidity…
most people in the market are looking for earnings and conventional measures. It’s liquidity that moves markets.”
Stan Druckenmiller
Interest rates and the Fed. Two quotes worth repeating from two of the greatest investors of all time. One is a long-term value investor and the other is a great speculator. Both self-created billionaires from humble beginnings. Let’s keep a close eye on the recession watch charts over the next number of months.
Grab that coffee and find your favorite chair. This week’s post is a quick read. You’ll find commentary on the return challenges pension funds are facing and the political pressure that is mounting in cities and states most everywhere and I share with you a few of my favorite IPAs. Wishing you a wonderful weekend!
♦ If you are not signed up to receive my weekly On My Radar e-newsletter, you can subscribe here. ♦
Included in this week’s On My Radar:
- U.S. Recession Watch Charts
- League Urges CalPERS to Find Ways to Exceed 7% Return Projections — Not Going to Happen
- Trade Signals — Treasury 3.07% “Line in the Sand” Has Been Breached
- Personal Note — Top IPAs
U.S. Recession Watch Charts
Employment Trends Index
This chart looks at the Employment Trends Index and plots its movement.
- The idea is that improving employment conditions are good for the economy.
- An “Expansion” signal is generated when the index “Rises by 0.4%” (down arrows in the chart) and
- A “Contraction” signal is generated when the index “Falls by 4.80%” (up arrows in the chart)
- Take a look at the arrows relative to the grey areas that mark recessions. Note the relatively good accuracy in predicting recessions. Correct Signals = 100%. A perfect track record so far (of course, no guarantees).
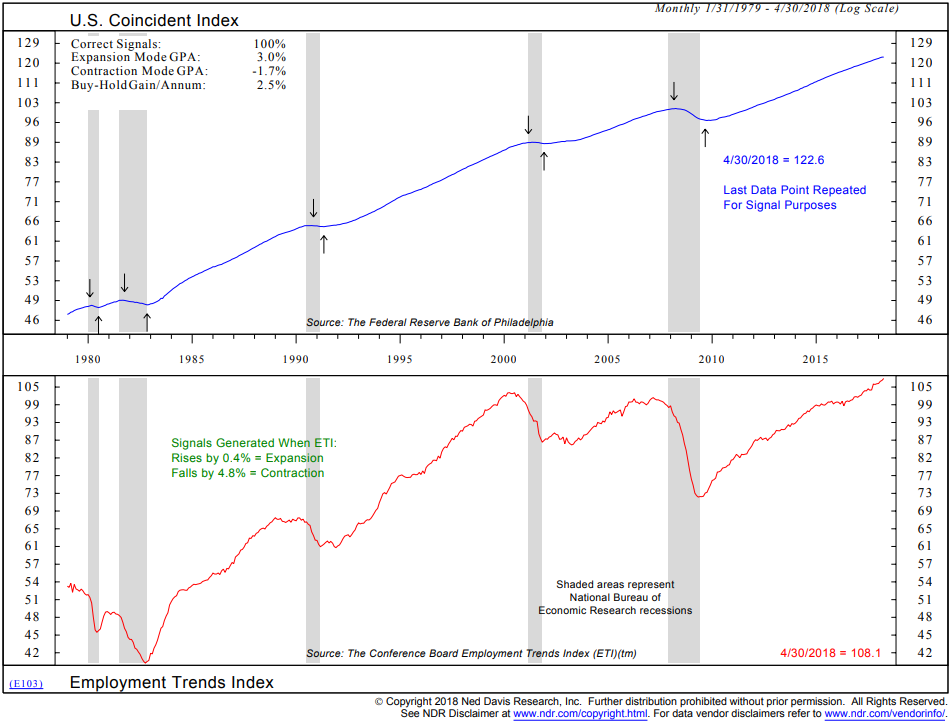
For us geeks: Data is updated monthly after the employment report is released the first Friday of each month. The components include: The Percentage of Respondents Who Say They Find “Jobs hard to get,” Initial Claims for Unemployment Insurance, Percentage of Firms with Positions Not Able to Fill Right Now, Number of Employees Hired by the Temporary-Help Industry, Part-Time Workers for Economic Reasons, Job Openings, Industrial Production and Real Manufacturing and Trade Sales. The components are equally weighted and volatility-adjusted.
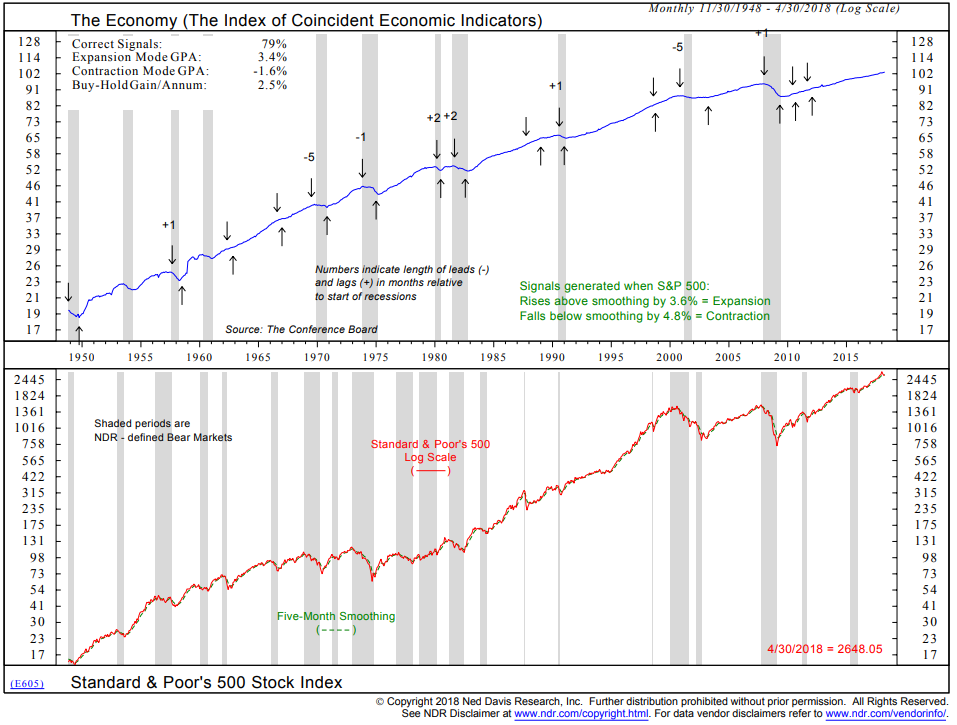
The Economy and the Stock Market
Here is how to read the chart:
- The bottom section plots the price trend of the S&P 500 Index (red line) and compares it to the five-month smoothed moving average of the S&P 500 Index.
- When the red price trend line rises above the green moving average line by 3.6%, an “Expansion” signal is generated (up arrows in the chart).
- When the red price trend line falls below the green moving average line by 4.8%, a “Contraction” signal is generated (down arrows in the chart).
- A +1 or +2 means that the signal came one or two months after recession was later deemed to have started (recessions are only known in hindsight).
- A -5 means the signal was early by 5 months.
- Correct signals = 79% (that’s pretty good).
- Bottom line: The stock market is a good leading economic recession and expansion indicator. No current sign of recession in the U.S.
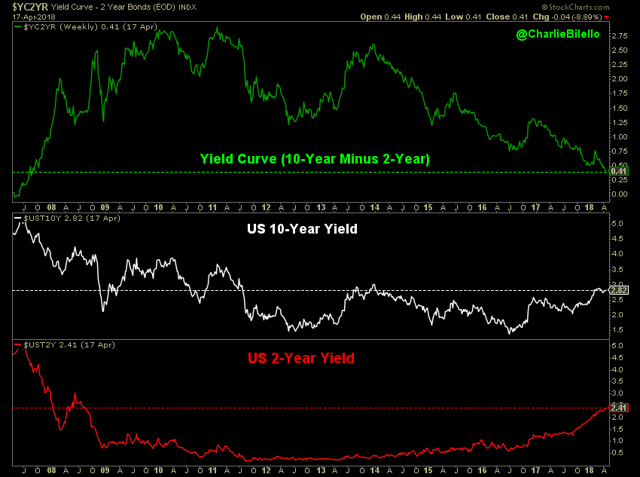
The Inverted Treasury Yield Curve
An inverted yield curve is an interest rate environment in which long-term debt instruments have a lower yield than short-term debt instruments of the same credit quality.
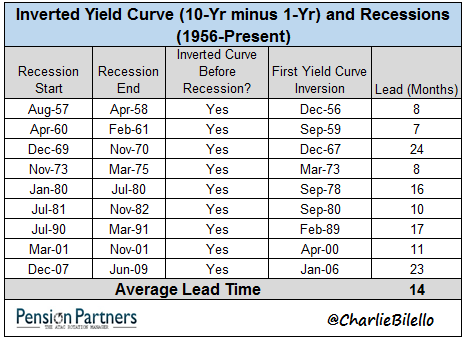
Here is the track record of Inverted Yield Curve that looks at the 1-year yield vs. the 10-year yield. While many people may feel the inverted yield curve has little merit, this data argues otherwise:
The Inverted Public Markets Yield Curve
I shared the following chart with you a few weeks ago. The private sector may hold the real clues to recession risk. “While the flattening U.S. yield curve — the difference between short- and longer-dated Treasurys — has been closely watched as a potential indicator of a looming contraction, investors might do better to watch a measure of the cost of private credit, according to Charles Gave of Gavekal Capital Ltd.” (Source: Bloomberg.)
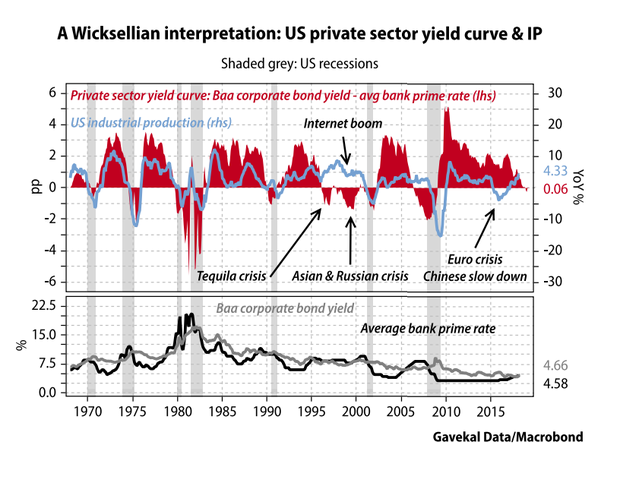
May 18, 2018 Prime Rate vs. Baa Yield 0.14% from inversion.
- Current prime rate: 4.75%
- Baa Corporate Bond Yield: 4.89%
Bottom line: Close to inversion. To be watched.
Either a U.S. recession has taken place within a year of the private sector yield curve inverting, or a “financial accident” has occurred in other economies with currency links to the U.S. dollar, according to Gave’s data.
Prime rates below the natural rate of corporate credit have allowed banks to generate “artificial” money, kept “zombie” companies alive, and enabled other corporates to engage in “financial engineering” predicated on cheap borrowing costs that risk toppling over if the curve inverts, Gave said.
Based on this measure, “we are entering dangerous territory,” he concluded. If the private sector curve inverts “zombie companies will fail and capital spending will be cut, as firms move to service debt and repay principal. Workers will get laid off and the economy will move into recession.
Source: Bloomberg
Is recession locked in stone on any one of these indicators? The answer is no. Investing is a risk/reward game. There is always risk. Key is to balance your potential for upside gain with prudent downside risk management.
Finally, here is a look at a collection of early U.S. recession indicators:
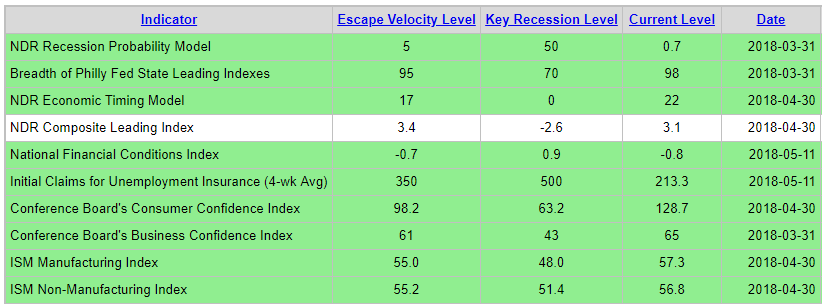
Bottom line: A lot of green. Green is good. No current sign of recession.
Ned Davis Research, Inc. (NDR), d.b.a. Ned Davis Research Group (NDRG), any NDRG affiliates or employees, or any third-party data provider, shall not have any liability for any loss sustained by anyone who has relied on the information contained in any NDRG publication. The data and analysis contained herein are provided “as is.” NDRG disclaims any and all express or implied warranties, including, but not limited to, any warranties of merchantability, suitability or fitness for a particular purpose or use. NDRG’s past recommendations and model results are not a guarantee of future results. This communication reflects our analysts’ opinions as of the date of this communication and will not necessarily be updated as views or information change. All opinions expressed herein are subject to change without notice. NDRG or its affiliated companies or their respective shareholders, directors, officers and/or employees, may have long or short positions in the securities discussed herein and may purchase or sell such securities without notice. For NDRG’s important additional disclaimers, refer to www.ndr.com/invest/public/copyright.html. For data vendor disclaimers, refer to www.ndr.com/vendorinfo. Further distribution prohibited without prior permission. Copyright 2018 © Ned Davis Research, Inc. All rights reserved.
League Urges CalPERS to Find Ways to Exceed 7% Return Projections – Not Going to Happen
“Cover the head, expose the feet. Cover the feet, exposure the head.”
My wife, Susan, is a soccer coach and we always talk tactics. If you press your defensive line high up the field, you take care of one risk but you expose another. If you drop your defense back closer to the goal, you run risk of allowing too much space for the other team to quickly get to your goal. Cover the head, expose the feet… One risk prevented exposes another. Much depends on the quality of the players and how they are positioned on the field. Tactics…
Central bankers put into play an aggressive program called quantitative easing (QE). The goal was to save the economy and the banking system. To a large extent, it worked. But that tactic, which drove interest down towards 0% and negative in much of the world, hurt the trillions of dollars invested in fixed income assets. How can a pension fund earn 7% when 10-year Treasury Notes yield 3%?
CalPERS is the largest pension fund in the U.S. and like many others everywhere, warning sirens are starting to blow. The following from its Chief Investment Officer:
Spokesman said cities will not be able to pay monthly contributions if returns are that low. [SB here: meaning 7% is “that low.” 4% might be a more realistic/prudent target, but that would mean pension benefit cuts and higher required capital participation rates. Tough to do politically but that’s the coming pension crisis. We’ll look at the forward return outlook further in this piece.]
The legislative representative to the League of California Cities urged the CalPERS Investment Committee Monday to think “out of the box” in finding a way to exceed its 7% investment return projections, saying that cities won’t be able to pay their monthly contributions to the pension plan if returns are that low.
Dane Hutchings cited a CalPERS September 2017 report, which showed that 180 of the 449 cities and towns that participate in CalPERS had an individual funding ratio of between 60% and 70%. Sounding a warning alarm, Hutchings said a significant number of those communities could fall between the 50% and 60% funded when new CalPERS data come out in August.
The 50% level of funding is considered the beginning of a death spiral for a pension plan.
Hutchings told CIO in a separate interview that many cities and towns will be in dire financial condition because of increased contributions to CalPERS. In some cases, contributions by cities and towns are increasing by 20% or more over the next few years.
Bankruptcy is a real threat…
Source: Chief Investment Officer
The next chart shows the historic average asset allocation of large pension funds and public pension funds. Think about the asset class exposures as you view it and we’ll then look at potential returns. In the back of your mind, hold onto the 7% return target and we’ll assess the probabilities:
Data through 2014:
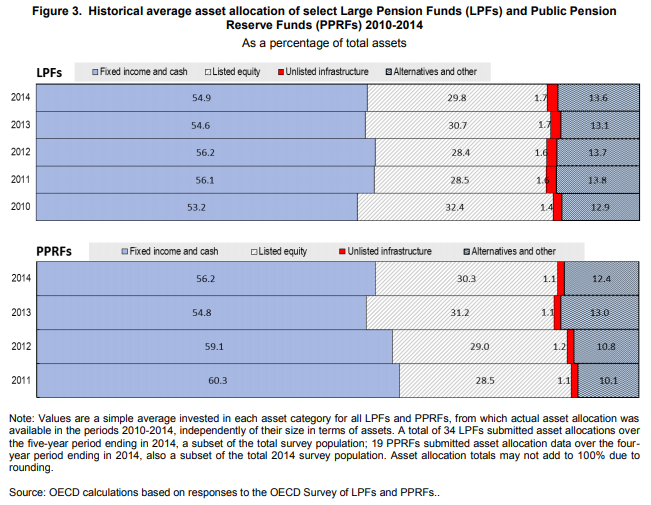
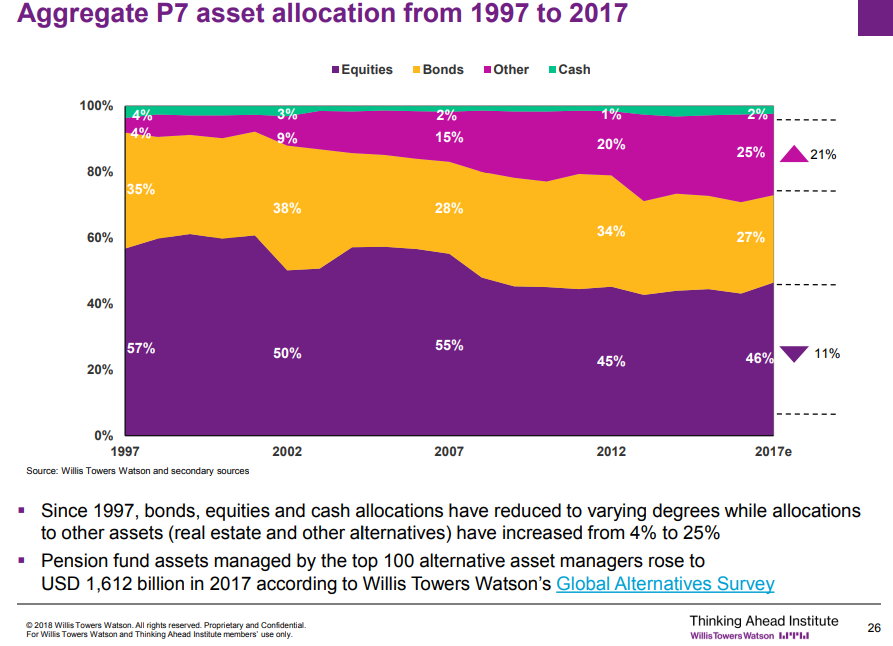
Here is a more recent allocation summary. Idea is to get a sense for how pensions are positioned:
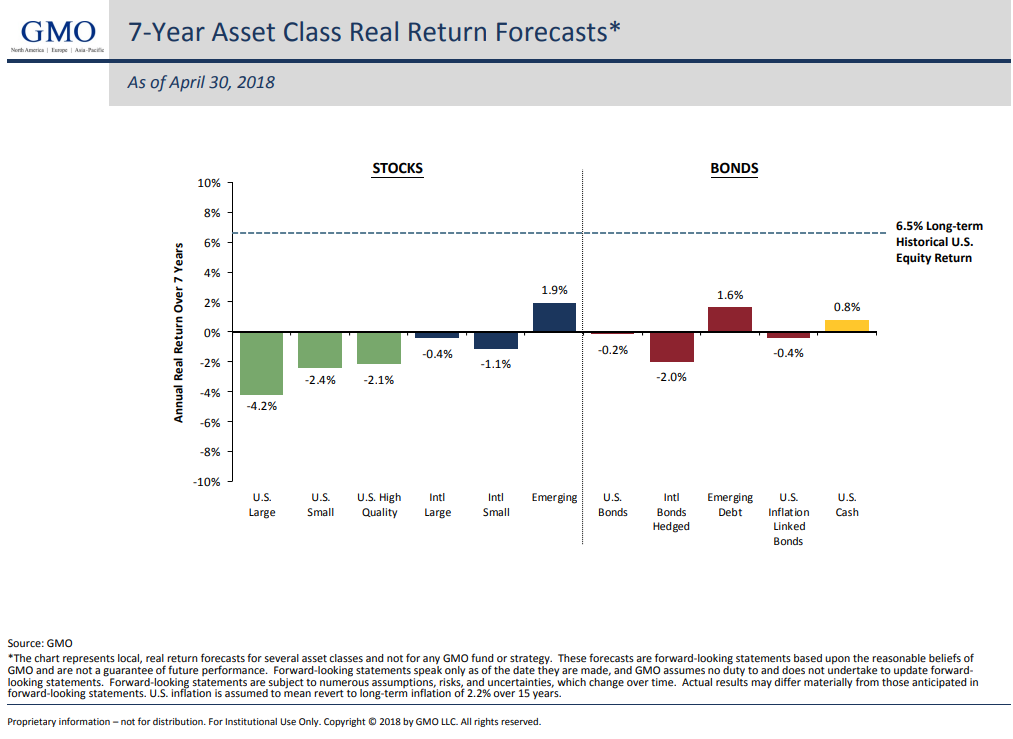
Next, here is the latest 7-Year Real Return estimates from GMO. I know, I know, depressing our collective problem is that GMO has a long-term high prediction accuracy rate so it should not be readily dismissed. Real means after inflation, so add 2.5% to each number if you want to feel a little more optimistic. Anyway, pensions are trying to hit 7% before inflation so adding that back in makes sense for our discussion. Still nowhere achieving 7%.
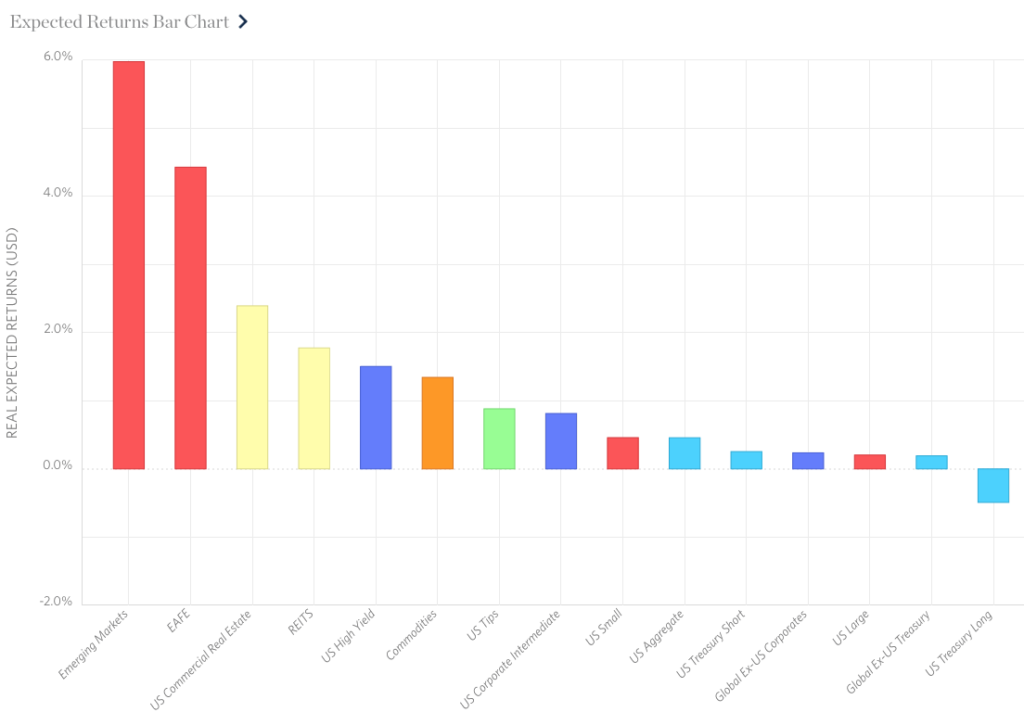
You may be slightly more comforted by Research Affiliates’ 10-year real return forecast:
We’ll take a deeper look at the most current valuations and what they tell us about forward returns in early June. My overall point is simple: the probability of CalPERS and other pension funds hitting a 7% bogey is really low.
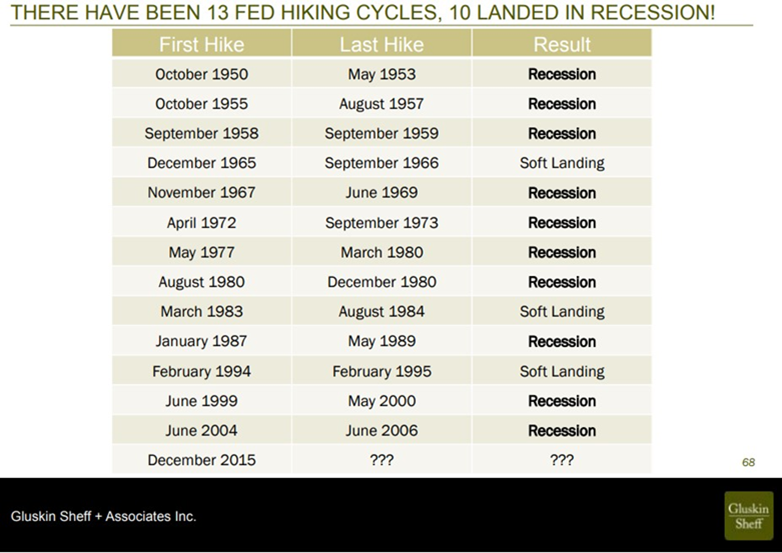
Look, we are late cycle in the economy. The Fed is raising rates. There have been 13 Fed hiking cycles and 10 of them have landed us in recession.
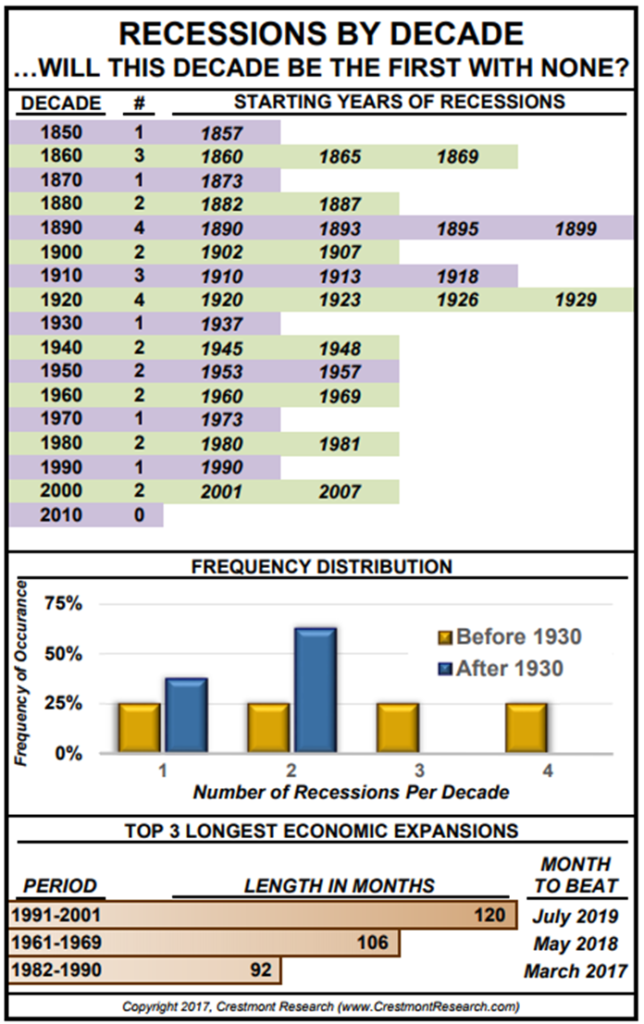
Here is a look at recessions by decade:
We have never been more in debt (in the U.S. and globally). We are now in the 14th Fed rate hiking cycle. I’m confident that rising rates will have a quicker negative impact on the economy and the record will soon move from 10-of-13 to 11-of-14.
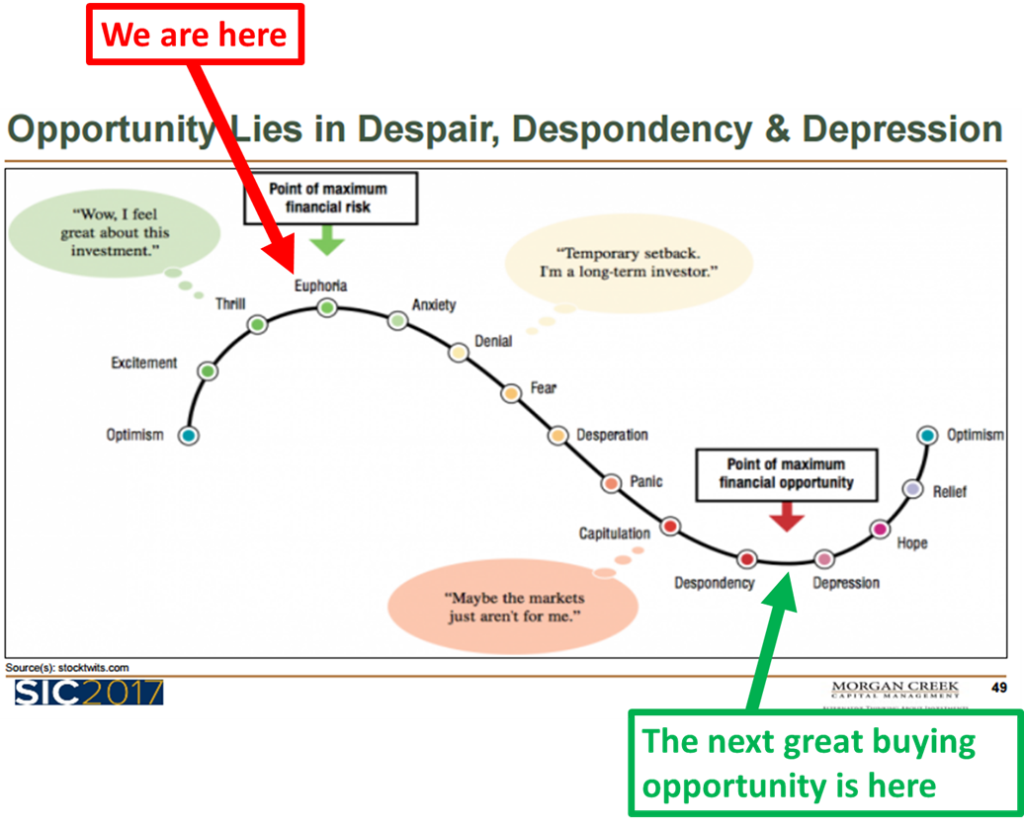
The last two recessions saw the U.S. equity markets decline more than 50%. The next will prove equally as challenging due to the level of debt and underfunded and growing pension obligations. The demographics are reaching a point where more and more retirees are drawing income from their plans. The timing of the next storm couldn’t be worse. More defense than offense until we get to the “green arrow” in the next chart.
Trade Signals – Bearish Bond Signals, Moderately Bullish Equity Signals, 200-Day MA Holding
S&P 500 Index — 2,694 (05-16-2018)
Notable this week:
The Ned Davis Research CMG U.S. Large Cap Long/Flat Index remains at a moderately bullish 80% large cap exposure buy signal (down from 100%). The 13-week trend line vs. the 34-week trend line remains on a “buy” signal; however, the short-term 13-week moving average is rolling down. Volume demand continues to be greater than volume supply, which also supports a bullish posture. The CMG Managed High Yield Bond Program is in a “sell” signal. Gold remains in a long-term cyclical bull market trend. The Zweig Bond Model remains on a sell and the 10-year Treasury Note yield continues to flirt with 3%. I view 3.07% as the line in the sand. Yesterday, JP Morgan’s Jamie Dimon said he would be surprised to see the 10-year going at 4%. That will shock the markets. Note that the next chart plots the yield and shows the current 2.995% yield as 29.95 (not sure why it is shown that way). Bottom line: we are flirting with a break in yields to the upside.
The next section walks you through all of the Trade Signals charts.
Click HERE for the latest Trade Signals.
Important note: Not a recommendation for you to buy or sell any security. For information purposes only. Please talk with your advisor about needs, goals, time horizon and risk tolerances.
Long-time readers know that I am a big fan of Ned Davis Research. I’ve been a client for years and value their service. If you’re interested in learning more about NDR, please call John P. Kornack Jr., Institutional Sales Manager, at 617-279-4876. John’s email address is jkornack@ndr.com. I am not compensated in any way by NDR. I’m just a fan of their work.
Personal Note – Top IPAs
I’ll be in NYC next Tuesday for meetings and a media event with VanEck and Ned Davis Research. My fingers are crossed that this weekend isn’t the weather washout it is shaping up to be. Brianna and Tyler are coming home. Brianna for the weekend and Tyler is home from school for a week prior to getting his rear-end kicked at Quantico for six weeks. He’s a Marine going through ROTC at Cornell University. He’s ready. I see a big cook out and a nice cold IPA in the immediate future.
I think of IPAs like I think of fine wine. For me it is about the taste and it is fun to try and find something new. Though I do have my favorites. My current top three:
- Fat Head’s Head Hunter IPA (Brianna turned us on to this one and it currently sits in the number one position).
- Ballast Point Grapefruit Sculpin IPA
- Levante Cloudy and Cumbersome (sounds like fit for the wet weekend)
Draft magazine did a tasting of 387 IPAs. Coming in first place is a new name to me, Stay G-O-L-D IPA by Burial Beer from Brooklyn, NY. Maybe a financial message to us? Anyway, I’m going to have to track it down. Click here to see Draft’s 50 Best IPAs in America. Let me know if you have a recommendation. Have a fun weekend!
Wishing the very best to you and your family. ♦ If you are not signed up to receive my weekly On My Radar e-newsletter, you can subscribe here. ♦
With kind regards,
Steve
Stephen B. Blumenthal
Executive Chairman & CIO

