
As part of Merk’s in-house research we regularly evaluate a consistent set of charts covering the economy, equities, fixed income, commodities and currencies. The aim is to keep our eyes open and to look through the noise of the headlines, avoiding the distractions of sensationalized click-bait. In sharing this content, we offer a cross-check to your own thinking and aim to add value to your own process.
Q1 hedge fund letters, conference, scoops etc, Also read Lear Capital: Financial Products You Should Avoid?
Today’s topic: inflation. One reason inflation is potentially relevant is that it is typically rising and/or at a relatively high level going into a recession, and therefore relates to thinking about the business cycle.
We invite you to download a copy of the slide deck (PDF); or to view the video:
U.S. Inflation Chart Book
Average U.S. Inflation Measure
Average of Core and Headline Rates YoY of Personal Consumption Expenditures (PCE) Index and Consumer Price Index (CPI)
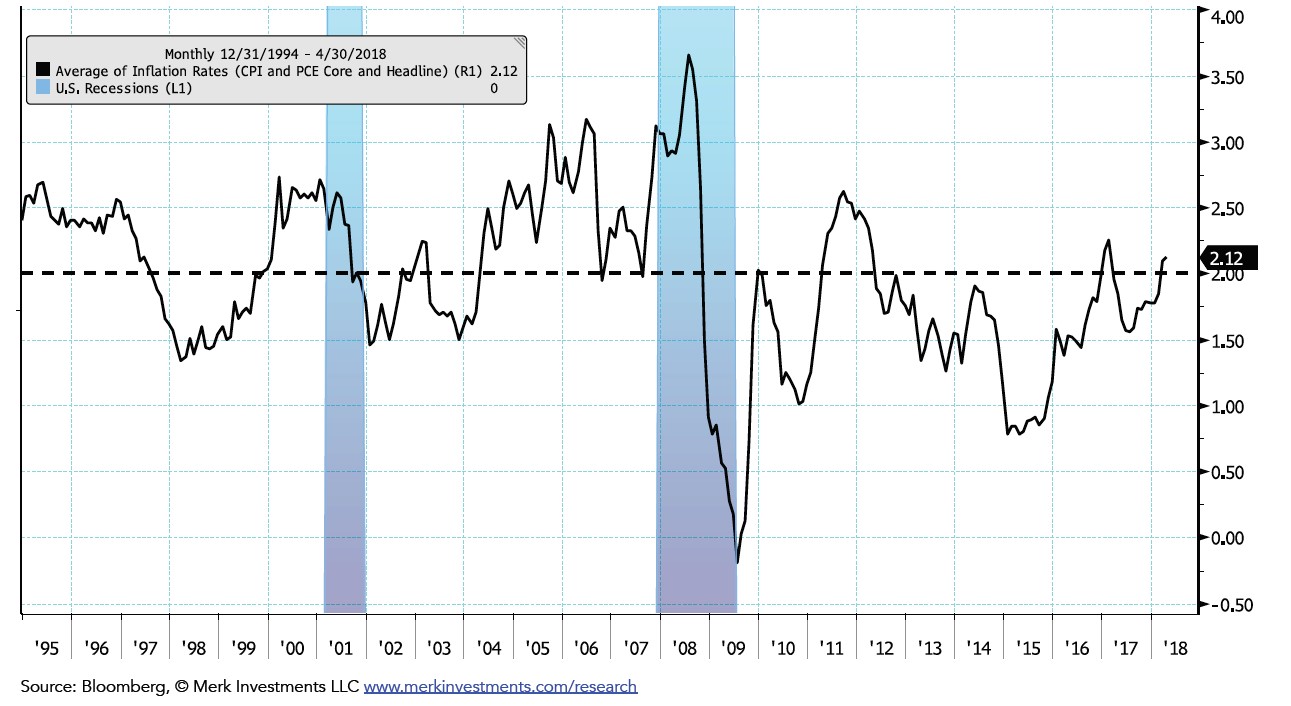
Analysis: One reason inflation is potentially relevant is that it is typically rising and/or at a relatively high level going into a recession, and therefore relates to thinking about the business cycle. On this chart the inflation average was above 2.5% YoY when recessions started. Inflation tends to decline during recessionary periods: from about 2.5% to 1.5% in 2001 and from about 3% to 0% in 2008-2009 (the oil price hit a high of $145/barrel in July 2008). The average of the four measures is now back above the 2% Fed inflation target. Powell has described the target as symmetric, meaning he is seeking to prevent persistent deviations from the 2% target in either direction.. Part of the recent rise in mannual inflation readings is due to “base-effects,” which are effects based on kinks in the data series from the “base” data point used to calculate the YoY rate of change.
Headline CPI and PCE Index
Looking out for base effects in the benchmark CPI and PCE headline indexes
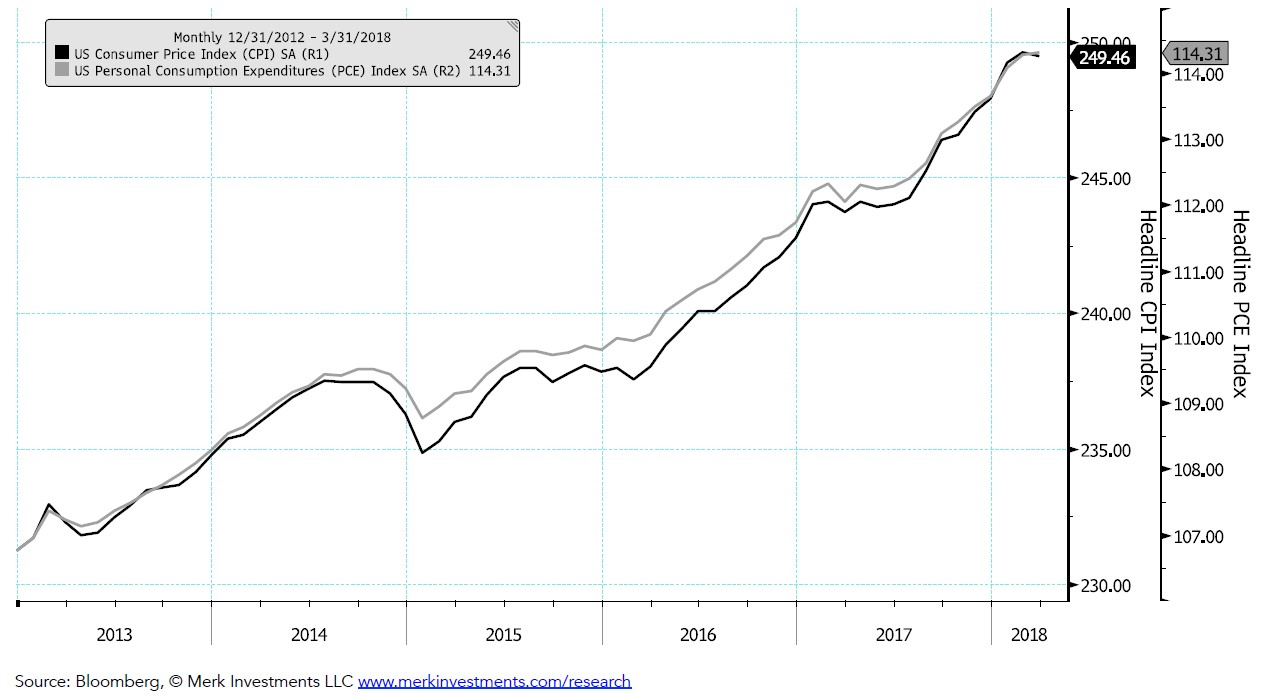
Analysis: In addition to tracking the YoY inflation readings, it is helpful to look at the underlying index levels as base effects (i.e., the index level one year ago) can be a factor, for example the indexes moved sideways into the summer last year which suggests a lower than normal baseline from which to measure YoY readings this coming summer, headline YoY readings are likely to be somewhat higher than they otherwise would be as a result. In theory this is all priced into consensus expectations but the release of inflation readings well above 2% could get markets to move, e.g., re-price fed rate hike expectations. As a reminder, headline PCE YoY is the Fed’s official inflation target- of course Fed officials are aware of base-effects. Sometimes even though economists are well aware of base-effects, I think market participants are surprised when readings come in relatively high, particularly if it means going from a reading below 2% to above 2%.
Oil “Base-effects”
The cumulative percentage change in the oil price over the past year
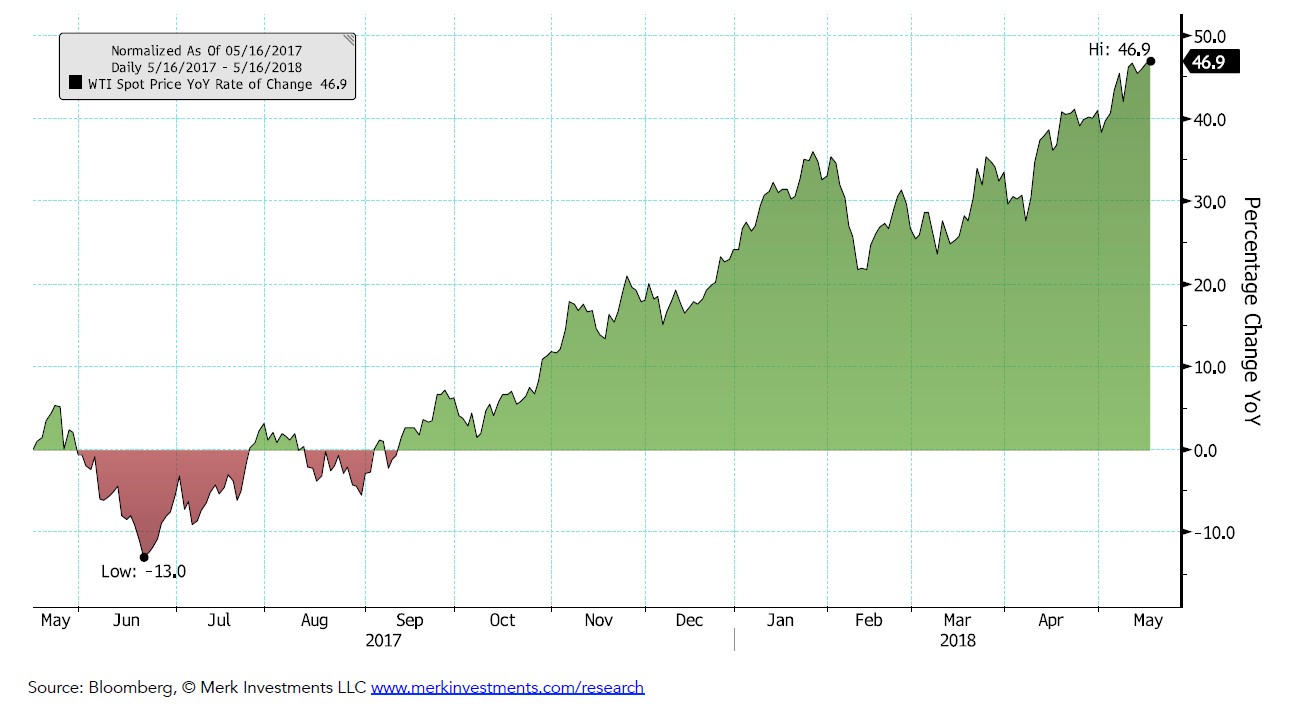
Analysis: the oil price can be a major factor in determining base effects in the indexes. As you can see from the chart, base-effects will be strongest in June 2018 given the lows in the oil price in June 2017.
Inflation Expectations and Oil
West Texas Intermediate (WTI) Oil Spot Price and the 5-year forward CPI annualized inflation expectation
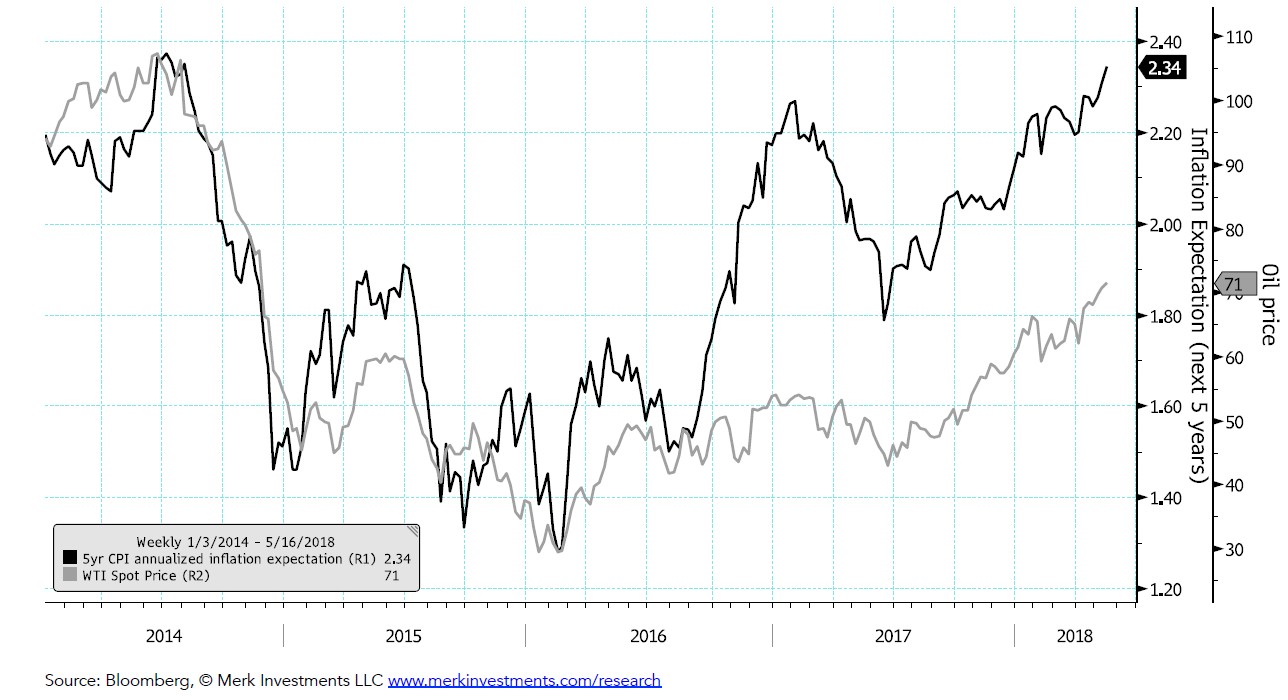
Analysis: it seems that annualized inflation expectations (over the subsequent 5 years) are closely related to the level of the oil price. This may relate to the idea of “cost-push” inflation- in other words, the idea that higher input costs such as energy will eventually be passed onto consumers. However energy is also a direct consumer good and appears to show up in CPI readings without a lag. I personally question whether it makes sense that the market expects a higher rate of inflation going forward based on a higher oil price today. Specifically, it seems possible that a higher oil price today would actually create future negative base effects for annual inflation readings. In any case, inflation expectations are important for Fed rate hike expectations and for bond yields further out the curve as they contain an inflation premium.
Labor Costs
Employment Cost Index and Small Business Compensation Plans (3-month lead)
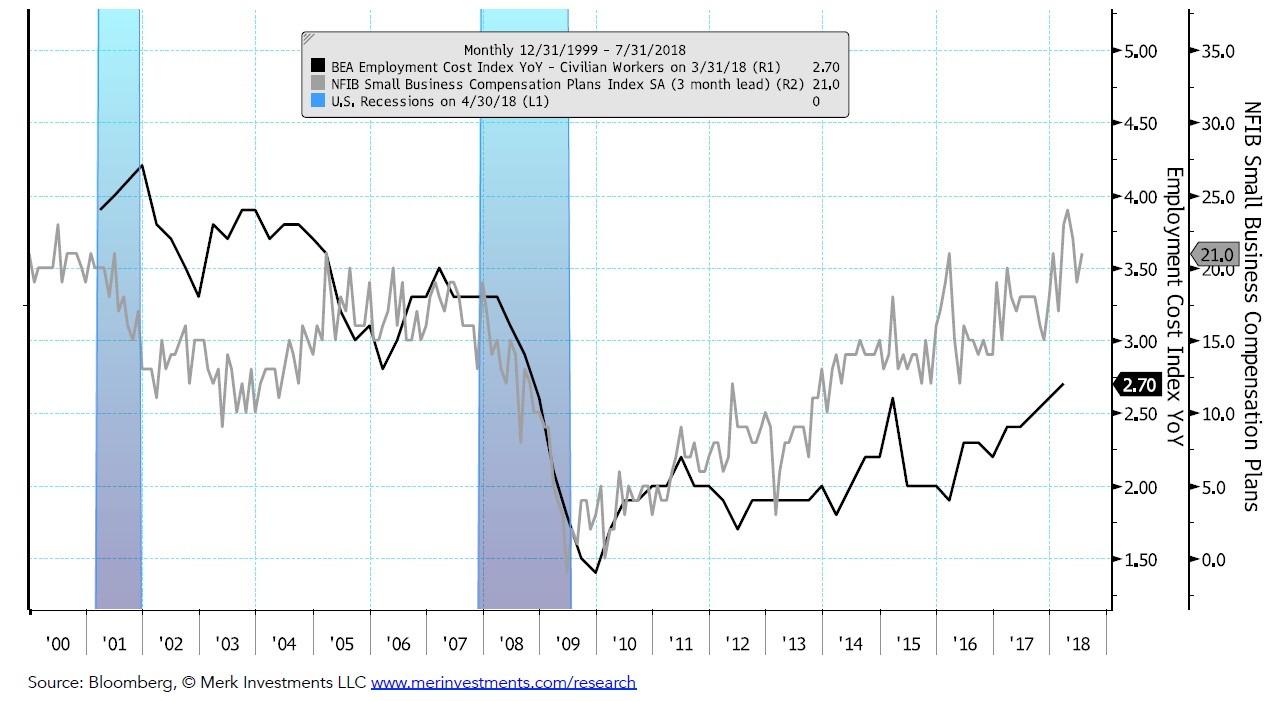
Analysis: The employment cost index (ECI), which many economists believe to be a better labor market inflation gauge than average hourly earnings, shows an uptrend that is supported by the rise in the NFIB Small Business Compensation Plans, which appears to be somewhat of a leading indicator for the ECI.
The idea that an increase in wages or employment costs might lead to overall inflation readings relates to the idea of “cost-push” inflation.
**On this chart the grey indicator is shifted forward on the x-axis to show the potential fit as a leading indicator**
Unemployment Rate and Wages
The relationship between the unemployment rate and wages is referred to as the “Phillips Curve”
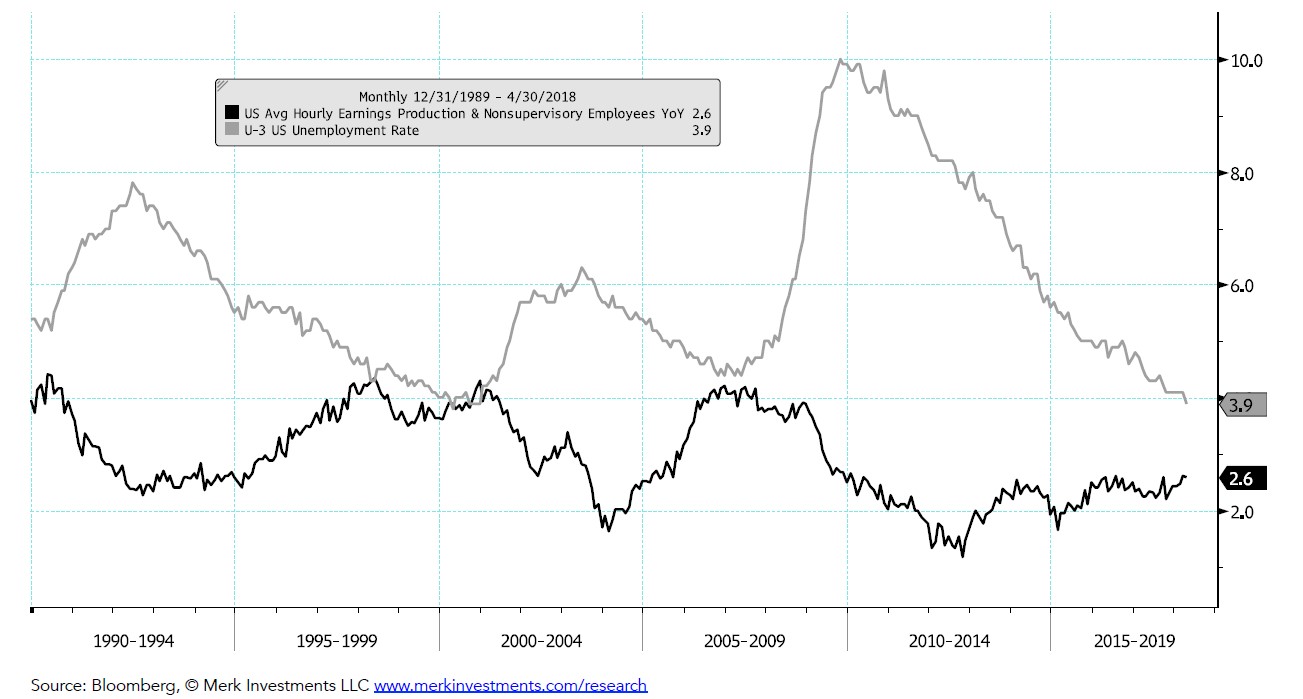
Analysis: This chart shows the relationship between the unemployment rate and wage inflation. The general thinking among most economists is that a lower unemployment rate is associated with a higher rate of wage inflation. This business cycle has so far shown relatively low wage inflation given how much the unemployment rate has declined. This chart is also included in the Fed Chart Book.
A number of commentators are suggesting that wage inflation is finally starting to come through.
See the full PDF below.
The investing audience should view this content in the context of their individual investment process, time-horizon, and goals.
| Publication Date | Chart Book Category | Video | Additional | |
| May 23, 2018 | U.S. Inflation | |||
| May 16, 2018 | U.S. Equity Market | Premium Charts: |
||
| May 9, 2018 | Business Cycle | |||
| May 2, 2018 | Fed Chart Book | |||
| April 19, 2018 | U.S. Equity Market | |||
| April 10, 2018 | Business Cycle | |||
| March 21, 2018 | U.S. Equity Market | |||
| March 14, 2018 | Business Cycle | |||
| February 14, 2018 | U.S. Equity Market | |||
| February 7, 2018 | Business Cycle | |||
| January 17, 2018 | U.S. Equity Market | |||
| January 10, 2018 | Business Cycle | |||
| December 12, 2017 | Business Cycle |
Merk Investments® LLC is an investment advisor registered with the Securities and Exchange Commission (“SEC”). This does not mean that we are sponsored, recommended, or approved by the SEC; or that our abilities or qualifications in any respect have been passed upon by the Commission or any officer of the Commission.
Article by Axel Merk, Merk Investments

