
FORECASTS & TRENDS E-LETTER
by Gary D. Halbert
April 24, 2018
Buy Side Trade Desks Budgets Finally Increase, But Robots Taking Human Bonuses
Q1 hedge fund letters, conference, scoops etc
1. Record # of Fidelity Clients Have $1 Million Saved For Retirement
2. How Washington Spends the Average Household’s Taxes
3. Social Security, Medicare, Welfare, Defense, Veterans, Etc.
4. Interest on the National Debt Set to Skyrocket in the Future
Overview
Today we’re going to look at how Washington spends our tax dollars. Specifically, we’ll look at a new report which shows how the federal government spends the income tax paid by the average family – and how they spend even more than what’s collected to create massive budget deficits year after year after year. I think you’ll find it very interesting.
But before we get to that discussion, I want to touch on some good news regarding retirement savings. As I have written often, the savings rate for the country at large is dangerously low. Yet a new report from Fidelity Investments revealed that the firm’s clients with at least $1 million in their 401(k)s or IRAs hit a new record high last year. Let’s get started.
Record # of Americans Have $1 Million Saved For Retirement
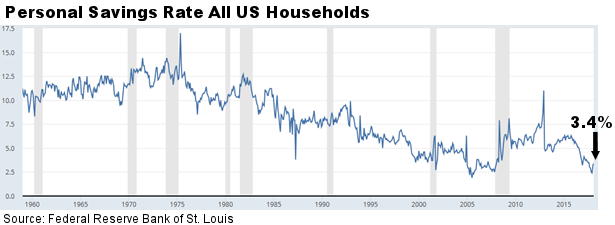
The US personal savings rate has been declining rather steadily for over 40 years. I’ve probably written on this disturbing trend as much as any single topic over the last 20-30 years. According to the Federal Reserve, the national savings rate fell to only 3.4% of income at the end of last year, down from over 10% in the 1960s and 1970s.
As Stocks Post Largest Loss In Weeks, Morgan Stanley Wonders If “Happy Hour” is Over?
We regularly hear alarming figures that up to 80% of US households don’t have enough in savings set aside to cover even a $1,000 surprise expenditure, such as a medical emergency or some other unexpected spending event.
While the savings rate among average Americans continues to fall (hopefully to bottom-out soon with the improving economy), the opposite is true among higher income/net worth Americans in recent years.
Recent data released by Fidelity Investments, the nation’s largest retirement account custodian, show the number of its clients with 401(k) balances of at least $1 million hit a record 150,000 at the end of 2017 – up from under 100,000 a year earlier. Likewise, the number of Fidelity-run IRAs with retirement savings balances of $1 million or more hit a new record of 152,000 last year.
The trend in higher income/net worth retirement account balances at Fidelity is widely believed to reflect a trend across the industry. While the increase is due, in part, to the stock market run-up in recent years, high income savers are setting more money aside for retirement, said Jeanne Thompson, a senior vice-president of Fidelity Investments.
Especially encouraging is the fact that women, in particular, are making significant strides when it comes to savings. The percentage of female 401(k) millionaires doubled in the last decade, Fidelity found, climbing to 20% in 2017 from 10% in 2005.
Nearly 3 in 10 savers increased their retirement contribution rate over the last year, Fidelity said. The average 401(k) contribution among high income/net worth investors rose to over 8.5% as of the end of last year, the highest percentage in almost 10 years.
That’s great news! Now, let’s hope the stronger economy and the recent upturn in average wages result in a nice rise in the national savings rate. We’ll see. Now let’s turn to our main topic for today.
How Washington Spends the Average Household’s Taxes
Many of you reading this filed your income tax return for 2017 earlier this month. During fiscal year 2017, the federal government received apprx. $3.3 trillion in tax and fee revenue and had outlays (spending) of apprx. $4.0 trillion – leaving a deficit of about $666 billion, up $80 billion from 2016.
Bank Of America: Arms race across Asia"
Some recently released data from the Manhattan Institute take a look at how Washington actually spends the taxes paid by the average US household. I think the numbers broken down by households are interesting, so let’s take a look.
This year, Washington will spend a near-record $33,054 per household but will collect only $26,198 per household in taxes. The resulting budget deficit of $6,856 per household will bring the total national debt to nearly $170,000 per household. That’s staggering!
Federal spending has soared more than $5,000 per household since 2007 and is projected to rise another $9,000 over the next decade (all numbers in this article are adjusted for inflation). Unless spending is reined in, large tax increases must eventually follow.
Given that the government is projected to spend $33,054 per household this year, let’s see how that money is spent. Again, hat tip to Brian Riedl at the Manhattan Institute. Here’s how the $33,054 breaks down.
Social Security/Medicare: $12,401
Well over a third of federal spending per household goes to funding Social Security and Medicare. The 15.3% payroll tax, split evenly between the employer and employee, covers most of Social Security’s and a portion of Medicare’s costs.
The typical couple retiring today will receive Social Security benefits 13% higher than their lifetime contributions, and Medicare benefits that are triple their lifetime contributions into the system, even after adjusting for inflation and net present values. Think about that.
As 74 million retiring Baby Boomers are added to this fragile system, paying all promised benefits would require payroll taxes rising to nearly $30,000 per household over the next few decades.
Anti-Poverty (Welfare) Programs: $6,112
Half of this spending subsidizes state Medicaid programs that provide health services to poor families. Other low-income spending includes: Temporary Assistance for Needy Families (TANF), food stamps, housing subsidies, child care subsidies, Supplemental Security Income (SSI) and low-income tax credits. President George W. Bush increased anti-poverty spending from $3,600 to $4,700 per household, and President Obama expanded it past $6,000, mostly due to ObamaCare costs.
Defense Spending: $5,046
The defense budget covers everything from military paychecks to operations in Iraq and Afghanistan, to the research, development and acquisition of new technologies, equipment, etc. Defense spending averaged $6,500 per household during the Cold War (1947-1991), before the Soviet Union collapse allowed late-1990s lawmakers to slash defense to $3,800 per household.
After the War on Terror pushed it back to $6,700 per household by 2010, deep cuts put defense on a path to $4,600 within the next decade. The recent budget deal in Congress will increase defense spending to $5,100 per household.
Interest on the National Debt: $2,434
The federal government is over $21 trillion in debt. It owes $16 trillion to public bond owners, and the rest to other federal agencies (mostly to repay the Social Security trust fund, which lawmakers raided annually before the program fell into permanent deficit in 2009).
Record-low interest rates have recently held down interest costs. However, the national debt is in the process of surging from $21 trillion to over $35 trillion between 2018 and 2028, which will push annual net interest costs from today’s $2,434 to at least $6,000 per household — or double that cost if interest rates rise back to normal levels.
Veterans’ Benefits: $1,390
According to the VA, there are apprx. 22 million veterans in the US, and apprx. four million have a service-related disability. The federal government provides income and health benefits to war veterans. Spending has doubled since 2001 as new wars have brought new veterans.
Federal Employee Retirement Benefits: $1,098
A portion of this cost is offset by federal employee payroll contributions.
Justice administration: $546
Justice spending includes federal attorneys and prisons, as well as law enforcement grant programs. Post-9/11 homeland security costs have modestly expanded this category.
Education: $537
Education spending is primarily a state and local function, but 9% of the K-12 total comes from Washington. Most federal dollars are spent on low-income school districts, special education and college student financial aid.
Health Research/Regulation: $533
This spending includes the National Institute of Health, Centers for Disease Control, Food and Drug Administration and dozens of grant programs for health providers.
Highways/Mass Transit: $487
The 18.4-cents-per-gallon federal gas tax finances most of these costs. Washington subtracts an administrative cost and sends this money back to the states with numerous strings attached.
International Affairs: $371
This includes foreign economic and military assistance, the operation of American embassies abroad and contributions to organizations such as the United Nations. International spending has nearly doubled since 9/11.
Disaster Relief: $338
Hurricanes and national disasters in Puerto Rico, Florida, Texas and elsewhere will cost taxpayers $43 billion this year — the most since Hurricane Katrina pushed these costs to $46 billion in 2006.
The programs listed above cover $31,293 per household. The remaining $1,761 is allocated to all other federal programs, including natural resources and the environment, unemployment benefits, economic development, farm subsidies, social services, space exploration, air transportation and energy.
In conclusion, the federal government will spend a near-record $33,054 per household on average this year but will collect only $26,198 per household in taxes. The resulting budget deficit of $6,856 per household will bring the total national debt to nearly $170,000 per household. And it grows every year. No wonder we have a national debt of over $21 trillion and rising!
All the best,
Gary D. Halbert
SPECIAL ARTICLES
More Americans Than Ever Have $1 Million Saved For Retirement
Why Support for the Tax Cuts is Flagging – Thank the Media
Gary’s Between the Lines Blog: CBO’s 10-Year Economic Forecast of 1.9% Growth is Too Low

