
Advisor Perspectives welcomes guest contributions. The views presented here do not necessarily represent those of Advisor Perspectives.
[activistinvesting]
Q2 hedge fund letters, conference, scoops etc
This article originally appeared on ETF.COM here.
Like clockwork, each year the S&P Dow Jones Indices Versus Active (SPIVA) scorecards report actively managed funds’ persistent failure to outperform appropriate, risk-adjusted benchmarks. The only thing different, it seems, is that each year the active management community contrives yet another explanation for its failure. And each time, those explanations are exposed as lame excuses, without any rationale to support them.
Looking back to 2015, the excuse making the rounds was that active managers’ poor performance was due to the market being very “narrow,” driven mainly by “FANG” stocks (Facebook, Amazon, Netflix and Google). Of course, that excuse held as much water as the proverbial sieve, because the market was no narrower than in most other years. Even if it was narrow, why didn’t active managers then simply overweight those stocks?
In other years, such as 2012, the excuse was that correlations of returns rose, presenting active managers with few opportunities to add value by distinguishing themselves. This excuse is nonsensical as well, because it’s not the correlations of returns that matters, but the actual dispersion of returns.
In fact, 2012, like all years, had a wide dispersion in returns. The amusing thing is that these two excuses, a narrow market and rising correlations, are mutually exclusive. Of course, if rising correlations was the problem, active managers should shine when they fall. However, they do equally poorly in years when correlations are low.
L.O.A.T (Lamest of all time)
Over the years, I have heard many lame excuses. But one from a 2016 article gets my vote for being the lamest of all time. The article cites the fact that “the number of publicly traded U.S. stocks has been on the decline since the dot-com bust, and there are now only about 3,300 listed in the Center for Research in Security Prices’ database. That’s down by roughly half since the late ’90s, and it’s the lowest number since 1984, when the U.S. population was about three-quarters the size it is today.”
This generated the following, from a report authored by an equity strategist at Jefferies: “The U.S. equity world is becoming smaller and smaller, and this could be one of many reasons why active managers are lagging behind their indexes.”
I guess the author believes that 3,300 stocks is just too small a pool for active managers to fish in! But if that isn’t enough to convince you, consider the following, which demonstrates there is plenty of opportunity for active managers to add value.
Recent evidence
Last year was another in which the large majority of active funds underperformed, despite the great opportunity active managers had to generate alpha through the large dispersion in returns between 2017’s best-performing and worst-performing stocks.
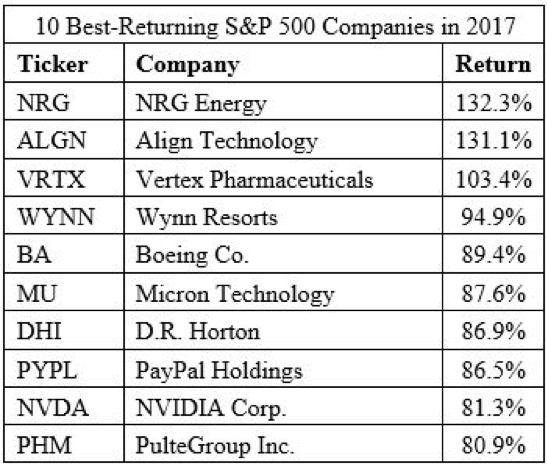
For example, while the S&P 500 returned 21.8% for the year, including dividends, in terms of price-only returns, 182 of the companies in the index were up more than 25%, 49 were up at least 50%, 10 were up at least 80.9% and three more than doubled in value. The following table shows the 10 best returners:

To outperform, all an active manager had to do was to overweight those big winners. On the other hand, there were 125 stocks within the index that, on a price-only basis, were down for the year. Fifty-nine stocks lost at least 10%, 20 were down at least 25%, and the 10 largest losers (see the following table) fell at least 44.2%:
To outperform, all an active manager had to do was to underweight, let alone avoid, these dogs.
Read the full article here by Larry Swedroe, Advisor Perspectives

